Motion graph analysis worksheets are a fantastic tool for students of all ages to develop a deeper understanding of kinematics, physics, and the visual representation of motion. These worksheets present graphs (typically displacement-time, velocity-time, or acceleration-time graphs) and challenge students to interpret the information conveyed, calculate relevant quantities, and draw conclusions about the motion of an object. Mastering this skill is crucial for success in physics courses and for developing general analytical abilities applicable across various fields.
These worksheets provide a visual and interactive way to learn about motion. Instead of just memorizing formulas, students learn to *see* how an object’s position, velocity, and acceleration change over time. They learn to associate slopes with velocities and areas under curves with displacement. This visualization makes the concepts more intuitive and easier to remember. Understanding motion graphs allows students to predict an object’s future position or velocity based on its past behavior. This predictive power is a cornerstone of scientific understanding.
Whether you are a teacher looking for resources for your classroom or a student seeking extra practice, understanding how to effectively use and interpret motion graph analysis worksheets is essential. This post will provide a sample motion graph analysis worksheet (implicitly, since I can’t directly *show* a graph) and a guide to answering it, along with the corresponding explanations. Remember, the key is not just finding the right answer but understanding *why* it’s the right answer.
Motion Graph Analysis Worksheet Sample (Displacement-Time)
Imagine a displacement-time graph representing the motion of a remote-controlled car. The graph is segmented into four distinct sections:
- Section 1: A straight line sloping upwards from the origin (0,0) to point A (5s, 10m).
- Section 2: A horizontal line from point A (5s, 10m) to point B (10s, 10m).
- Section 3: A straight line sloping downwards from point B (10s, 10m) to point C (15s, 0m).
- Section 4: A straight line sloping upwards from point C (15s, 0m) to point D (20s, 5m).
Based on this graph, answer the following questions:
- Question 1: During which time interval(s) is the car moving at a constant positive velocity?
- Question 2: During which time interval(s) is the car at rest?
- Question 3: During which time interval(s) is the car moving at a constant negative velocity?
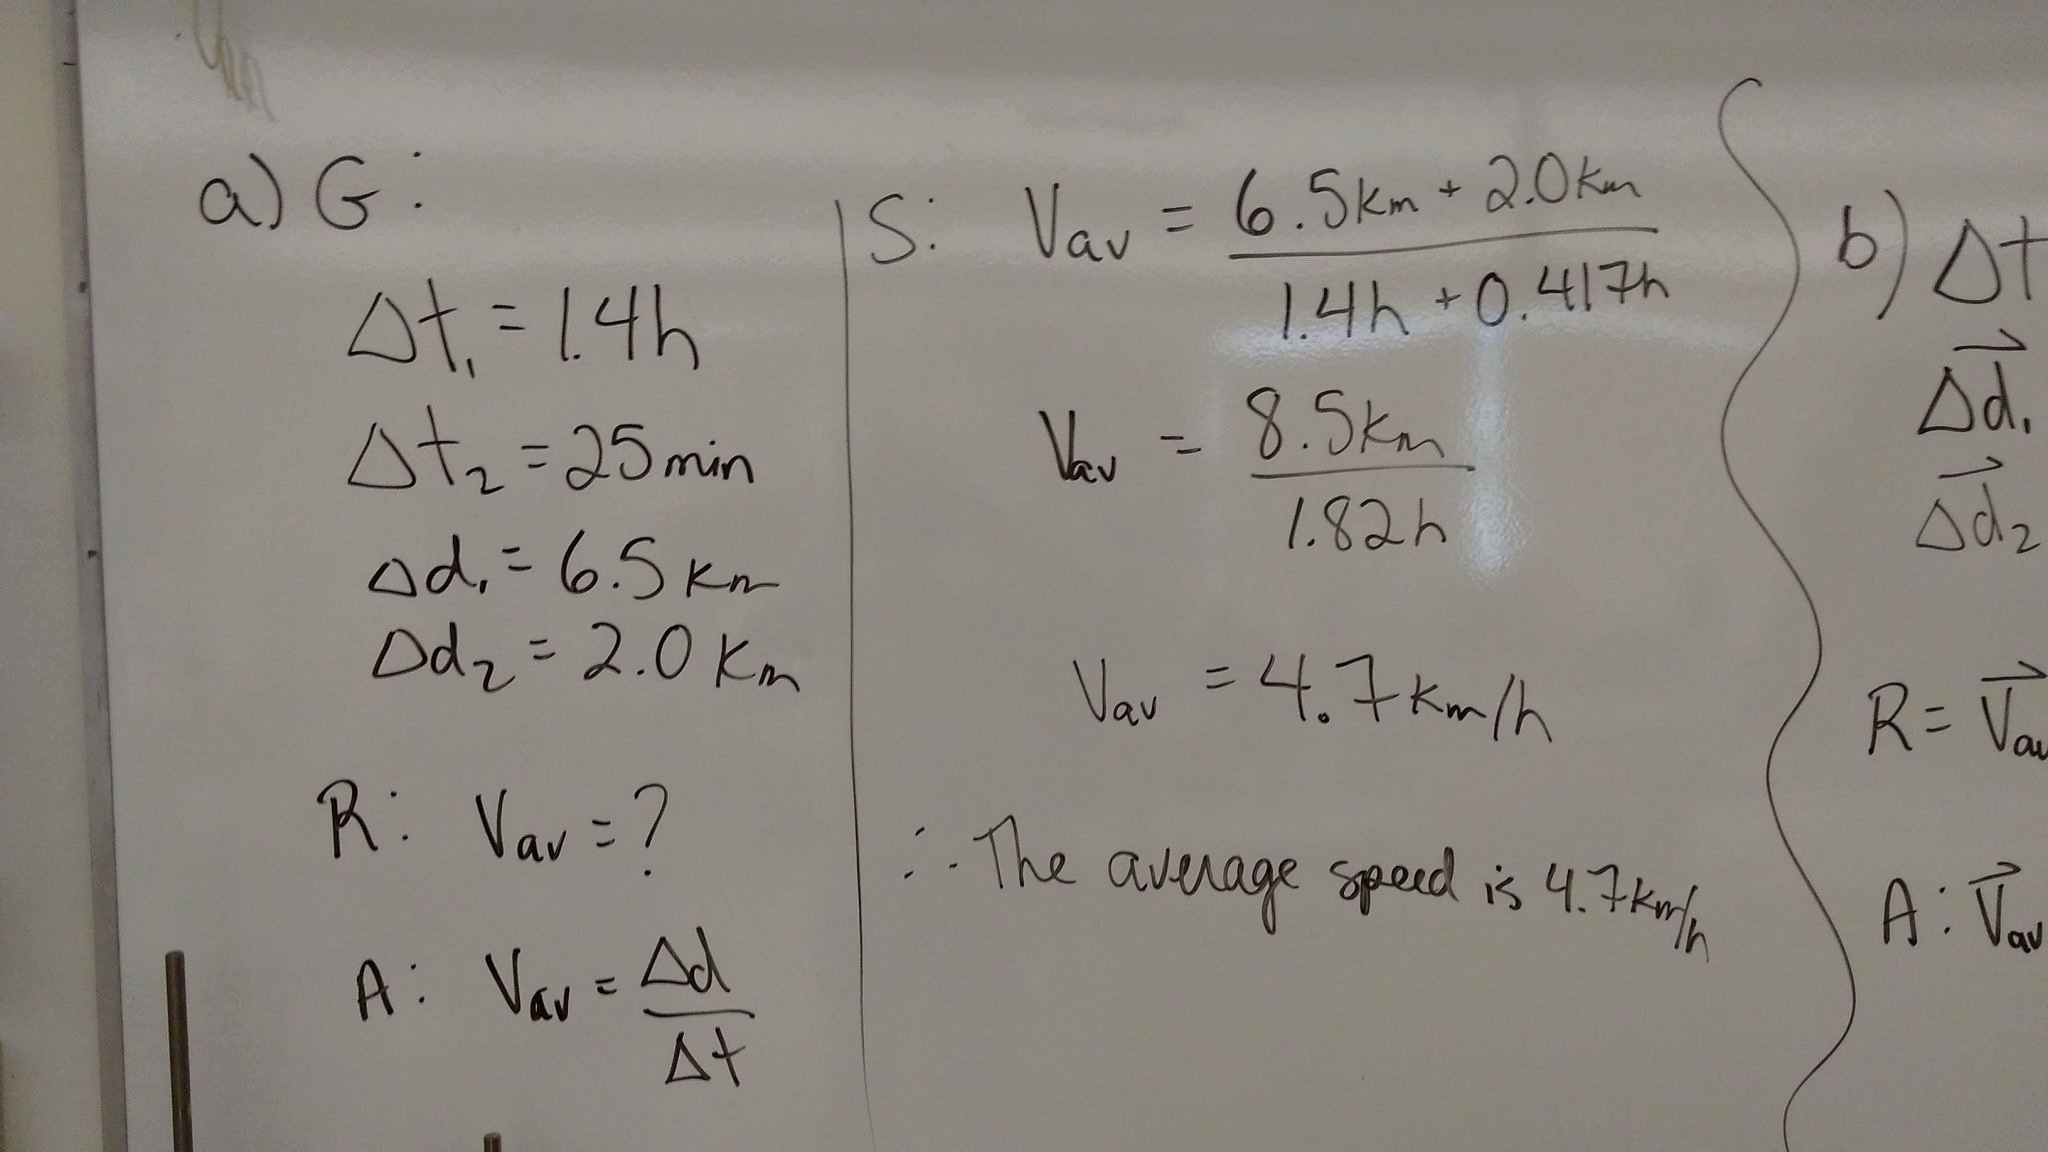
- Question 4: What is the car’s average velocity between 0s and 5s?
- Question 5: What is the car’s average velocity between 10s and 15s?
- Question 6: What is the car’s displacement between 15s and 20s?
- Question 7: What is the total distance traveled by the car between 0s and 20s?
Answers and Explanations
Here are the answers to the questions, along with detailed explanations of the reasoning behind each answer.
-
Question 1: During which time interval(s) is the car moving at a constant positive velocity?
- Answer: 0s to 5s and 15s to 20s
- Explanation: A constant positive velocity is represented by a straight line with a positive slope on a displacement-time graph. The steeper the slope, the greater the velocity. Section 1 (0s to 5s) and Section 4 (15s to 20s) both show upward-sloping straight lines.
-
Question 2: During which time interval(s) is the car at rest?
- Answer: 5s to 10s
- Explanation: A horizontal line on a displacement-time graph indicates that the object’s position is not changing, meaning it’s at rest. Section 2 (5s to 10s) shows a horizontal line at a constant displacement of 10m.
-
Question 3: During which time interval(s) is the car moving at a constant negative velocity?
- Answer: 10s to 15s
- Explanation: A constant negative velocity is represented by a straight line with a negative slope on a displacement-time graph. This means the car is moving back towards its starting point. Section 3 (10s to 15s) displays a downward-sloping straight line.
-
Question 4: What is the car’s average velocity between 0s and 5s?
- Answer: 2 m/s
- Explanation: Average velocity is calculated as displacement divided by time. In this interval, the displacement is 10m – 0m = 10m, and the time is 5s – 0s = 5s. Therefore, the average velocity is 10m / 5s = 2 m/s.
-
Question 5: What is the car’s average velocity between 10s and 15s?
- Answer: -2 m/s
- Explanation: Again, average velocity is displacement divided by time. In this interval, the displacement is 0m – 10m = -10m, and the time is 15s – 10s = 5s. Therefore, the average velocity is -10m / 5s = -2 m/s. The negative sign indicates the car is moving in the opposite direction.
-
Question 6: What is the car’s displacement between 15s and 20s?
- Answer: 5m
- Explanation: Displacement is the change in position. The car’s position at 20s is 5m, and its position at 15s is 0m. Therefore, the displacement is 5m – 0m = 5m.
-
Question 7: What is the total distance traveled by the car between 0s and 20s?
- Answer: 25m
- Explanation: Total distance is the sum of all the distances traveled, regardless of direction. From 0s to 5s, the car travels 10m. From 5s to 10s, it travels 0m (it’s at rest). From 10s to 15s, it travels 10m (back to the origin). From 15s to 20s, it travels 5m. Therefore, the total distance is 10m + 0m + 10m + 5m = 25m. Note that total distance is *not* the same as displacement; displacement considers only the starting and ending points.
By working through motion graph analysis worksheets like this, students can develop a strong conceptual understanding of motion and improve their problem-solving skills in physics. Remember to focus on understanding the relationship between the graph’s features (slope, area, etc.) and the physical quantities they represent (velocity, displacement, etc.). Good luck!
If you are looking for Motion Graph Analysis Worksheet Eighth Grade, Seventh Grade, Science you’ve visit to the right place. We have 20 Pictures about Motion Graph Analysis Worksheet Eighth Grade, Seventh Grade, Science like Motion Graph Analysis Worksheet Elegant Graphing and Data Analysis, SOLUTION: Physics 10 Motion Graphs Worksheet and Answers – Studypool and also SOLUTION: THEA 210 The Dramatic Impulse Play Analysis Worksheet. Read more:
Motion Graph Analysis Worksheet Eighth Grade, Seventh Grade, Science

www.pinterest.es
Motion Graph Analysis Worksheet – Owhentheyanks.com
www.owhentheyanks.com
Motion Graph Analysis Worksheet – Owhentheyanks.com
![]()
www.owhentheyanks.com
Movie Analysis Worksheet | PDF – Worksheets Library

worksheets.clipart-library.com
Solved Motion Graphs & Kinematics Worksheet: You Must Show | Chegg.com

worksheets.clipart-library.com
SOLUTION: Physics 10 Motion Graphs Worksheet And Answers – Studypool

worksheets.clipart-library.com
Reading Bar Graphs Worksheet | Fun And Engaging 6th Grade PDF

worksheets.clipart-library.com
Motion Graph Analysis Worksheet – Owhentheyanks.com

www.owhentheyanks.com
Motion Graph Analysis Worksheet – Artofit

www.artofit.org
Free Graphing Motion Worksheet, Download Free Graphing Motion Worksheet

worksheets.clipart-library.com
Motion Graph Analysis Worksheet Inspirational Motion Graphs Practice

www.pinterest.com
Motion Graph Analysis Worksheet – Artofit

www.artofit.org
Motion Graph Analysis Worksheet – Pro Worksheet
www.proworksheet.my.id
Motion Graph Analysis Worksheet 2 .docx – Motion Graph Analysis The
www.coursehero.com
50 Motion Graph Analysis Worksheet | Chessmuseum Template Library

www.pinterest.com
Motion Graph Analysis Worksheet 50 Motion Graph Analysis Worksheet In

in.pinterest.com
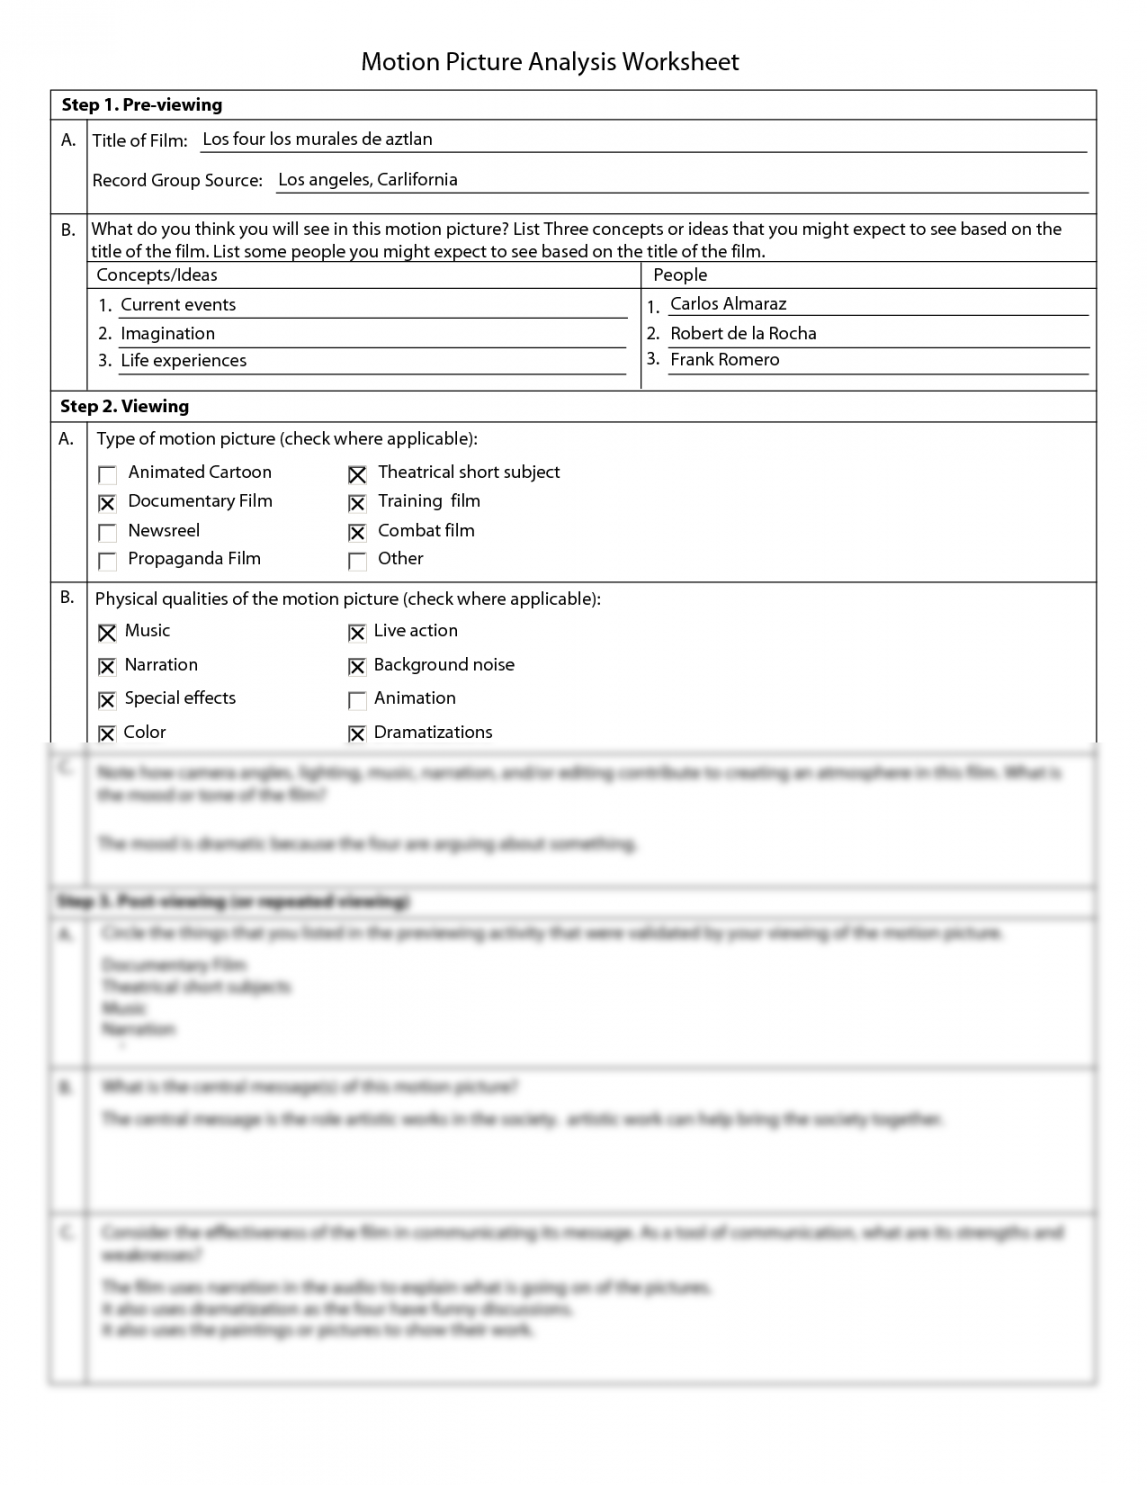
Motion Picture Analysis Worksheet – Printable PDF Template
martinlindelof.com
SOLUTION: THEA 210 The Dramatic Impulse Play Analysis Worksheet

worksheets.clipart-library.com
Motion Graph Analysis Worksheet Elegant Graphing And Data Analysis
chessmuseum.org
Motion Graph Analysis Worksheet – Ame.my.id
.jpg)
ame.my.id
Solution: thea 210 the dramatic impulse play analysis worksheet …. motion graph analysis worksheet inspirational motion graphs practice …. Motion graph analysis worksheet 2 .docx