Understanding motion is fundamental to physics, and one of the best tools for visualizing and analyzing motion is the velocity-time graph. These graphs provide a powerful way to represent the relationship between an object’s velocity and time, allowing us to determine acceleration, displacement, and even predict future motion. Many students encounter velocity-time graph worksheets as a part of their physics education. These worksheets often involve interpreting graphs, calculating values based on the graph, and applying kinematic equations. A common hurdle is ensuring accuracy and understanding the underlying principles rather than simply memorizing formulas. This post is designed to not only provide the answers to a typical velocity-time graph worksheet but also to reinforce the concepts needed to confidently solve these problems.
Decoding Velocity-Time Graphs: A Refresher
Before diving into the answers, let’s quickly review the key components and interpretations of velocity-time graphs. The vertical axis represents velocity (typically in meters per second, m/s), and the horizontal axis represents time (typically in seconds, s). Here’s what the graph can tell us:
- Slope of the line: Represents the acceleration of the object. A positive slope indicates acceleration, a negative slope indicates deceleration (or negative acceleration), and a zero slope indicates constant velocity. The slope is calculated as: Acceleration (a) = (Change in Velocity (Δv)) / (Change in Time (Δt)).
- Area under the curve: Represents the displacement (change in position) of the object. To find the area, we can use geometric shapes like rectangles, triangles, and trapezoids, or, for more complex curves, integration (calculus).
- Y-intercept: Represents the initial velocity of the object at time t=0.
- X-intercept: Represents the time at which the object’s velocity is zero; that is, the moment it stops moving (momentarily) or changes direction.
Remember, constant velocity is represented by a horizontal line, while constant acceleration is represented by a straight line with a non-zero slope. Curved lines indicate changing acceleration (which usually requires more advanced techniques to analyze fully). It’s also crucial to pay attention to the sign of the velocity. Positive velocity indicates movement in one direction, while negative velocity indicates movement in the opposite direction.
Common Worksheet Questions: And Their Solutions
Here’s a hypothetical velocity-time graph worksheet scenario and the solutions, presented in a clear and understandable way. We’ll assume the graph depicts the motion of a toy car along a straight track. Let’s say the worksheet contains the following questions based on a provided graph. The answers are below:
Imagine a Velocity-Time graph where: The x-axis (Time) goes from 0 to 10 seconds, and the y-axis (Velocity) goes from -5 m/s to 10 m/s.
The graph depicts the following:
* From 0 to 2 seconds, the velocity increases linearly from 0 m/s to 10 m/s.
* From 2 to 6 seconds, the velocity remains constant at 10 m/s.
* From 6 to 8 seconds, the velocity decreases linearly from 10 m/s to 0 m/s.
* From 8 to 10 seconds, the velocity decreases linearly from 0 m/s to -5 m/s.
Worksheet Questions:
- What is the acceleration of the toy car between 0 and 2 seconds?
- What is the velocity of the toy car at t = 4 seconds?
- What is the displacement of the toy car between 2 and 6 seconds?
- What is the acceleration of the toy car between 6 and 8 seconds?
- What is the total displacement of the toy car during the entire 10 seconds?
- At what time does the toy car change direction?
Here are the solutions:
- What is the acceleration of the toy car between 0 and 2 seconds?
- The initial velocity (vi) at t=0 is 0 m/s.
- The final velocity (vf) at t=2 is 10 m/s.
- Acceleration (a) = (vf – vi) / (tf – ti) = (10 m/s – 0 m/s) / (2 s – 0 s) = 5 m/s2
- Answer: 5 m/s2
- What is the velocity of the toy car at t = 4 seconds?
- Between 2 and 6 seconds, the velocity is constant at 10 m/s.
- Answer: 10 m/s
- What is the displacement of the toy car between 2 and 6 seconds?
- This is a rectangle on the graph with a height of 10 m/s and a width of 4 s (6 s – 2 s).
- Displacement = Area = Velocity * Time = 10 m/s * 4 s = 40 m
- Answer: 40 m
- What is the acceleration of the toy car between 6 and 8 seconds?
- The initial velocity (vi) at t=6 is 10 m/s.
- The final velocity (vf) at t=8 is 0 m/s.
- Acceleration (a) = (vf – vi) / (tf – ti) = (0 m/s – 10 m/s) / (8 s – 6 s) = -5 m/s2
- Answer: -5 m/s2
- What is the total displacement of the toy car during the entire 10 seconds?
- We need to find the area under the entire curve. This consists of: a triangle (0-2s), a rectangle (2-6s), a triangle (6-8s), and a triangle (8-10s but it should be taken as negative displacement as its in the negative velocity region).
- Area (triangle 0-2s) = 0.5 * base * height = 0.5 * 2 s * 10 m/s = 10 m
- Area (rectangle 2-6s) = base * height = 4 s * 10 m/s = 40 m
- Area (triangle 6-8s) = 0.5 * base * height = 0.5 * 2 s * 10 m/s = 10 m
- Area (triangle 8-10s) = 0.5 * base * height = 0.5 * 2 s * -5 m/s = -5 m
- Total Displacement = 10 m + 40 m + 10 m + (-5 m) = 55 m
- Answer: 55 m
- At what time does the toy car change direction?
- The toy car changes direction when the velocity changes from positive to negative. This occurs at t = 8 seconds.
- Answer: 8 seconds
By carefully analyzing the velocity-time graph and applying the principles of slope and area, we can accurately determine the motion of the object. Understanding these concepts is key to successfully navigating any velocity-time graph worksheet.
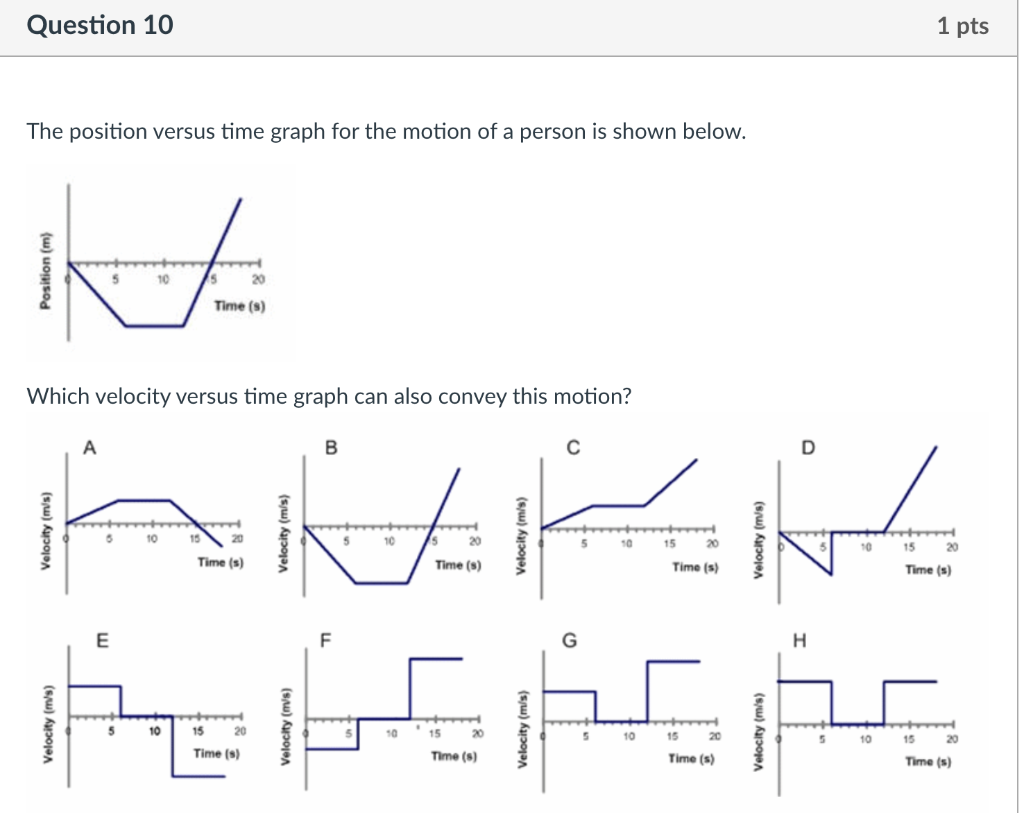
If you are searching about Solved The Position Versus Time Graph For The Motion Of A Chegg you’ve visit to the right page. We have 20 Pics about Solved The Position Versus Time Graph For The Motion Of A Chegg like Velocity Time Graph Worksheet Answers, Velocity Time Graph Worksheet Awesome Uniformly Accelerated Particle and also Velocity-Time Graphs | Teaching Resources – Worksheets Library. Read more:
Solved The Position Versus Time Graph For The Motion Of A Chegg
lisaworksheets.com
This Worksheet Is About Position-time And Velocity-time Graphs

worksheets.clipart-library.com
Worksheet-Velocity-Graph – Section:______ Name: Date:______ – Studocu

worksheets.clipart-library.com
Position Time Graph Worksheet With Answers
worksheetpic101.s3.amazonaws.com
Velocity Vs Time Graph Worksheet – Printable Word Searches

davida.davivienda.com
Velocity Time Graph Worksheet Awesome Uniformly Accelerated Particle

chessmuseum.org
Speed Velocity And Acceleration Worksheet – Pro Worksheet
www.proworksheet.my.id
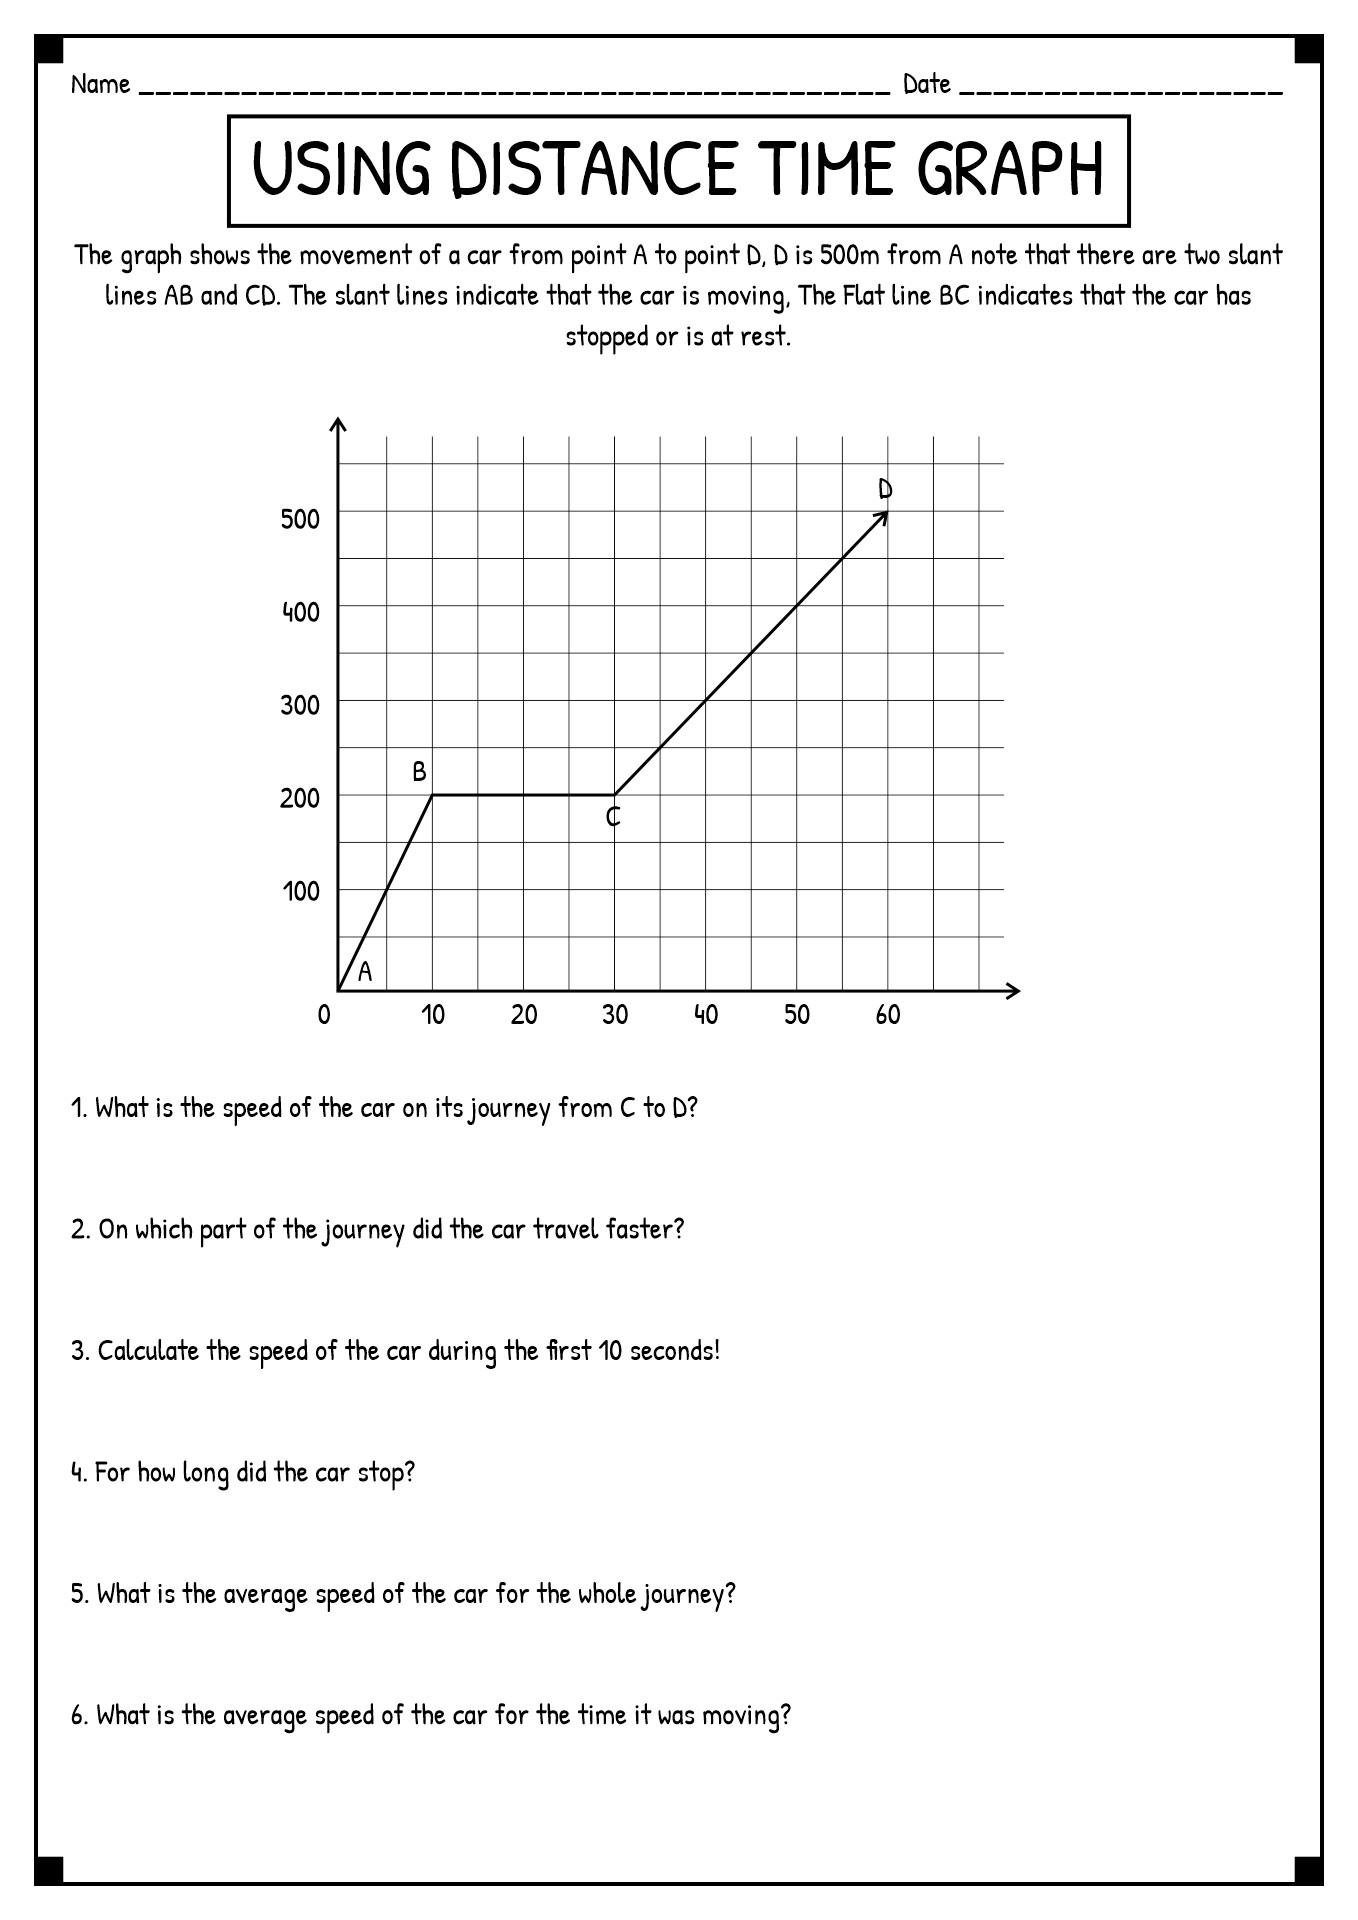
Reading Distance Time Graphs Worksheet
printablegnusobimab1.z22.web.core.windows.net
Velocity Time Graph Worksheet With Answers
worksheetpic101.s3.amazonaws.com
Velocity-Time Graphs | Teaching Resources – Worksheets Library
worksheets.clipart-library.com
Velocity Time Graph Worksheet Answers
www.e-streetlight.com
Velocity Time Graph Worksheet Answers
zipworksheet.com
Velocity Time Graph Tes Worksheets – Worksheets Day

www.worksheetsday.com
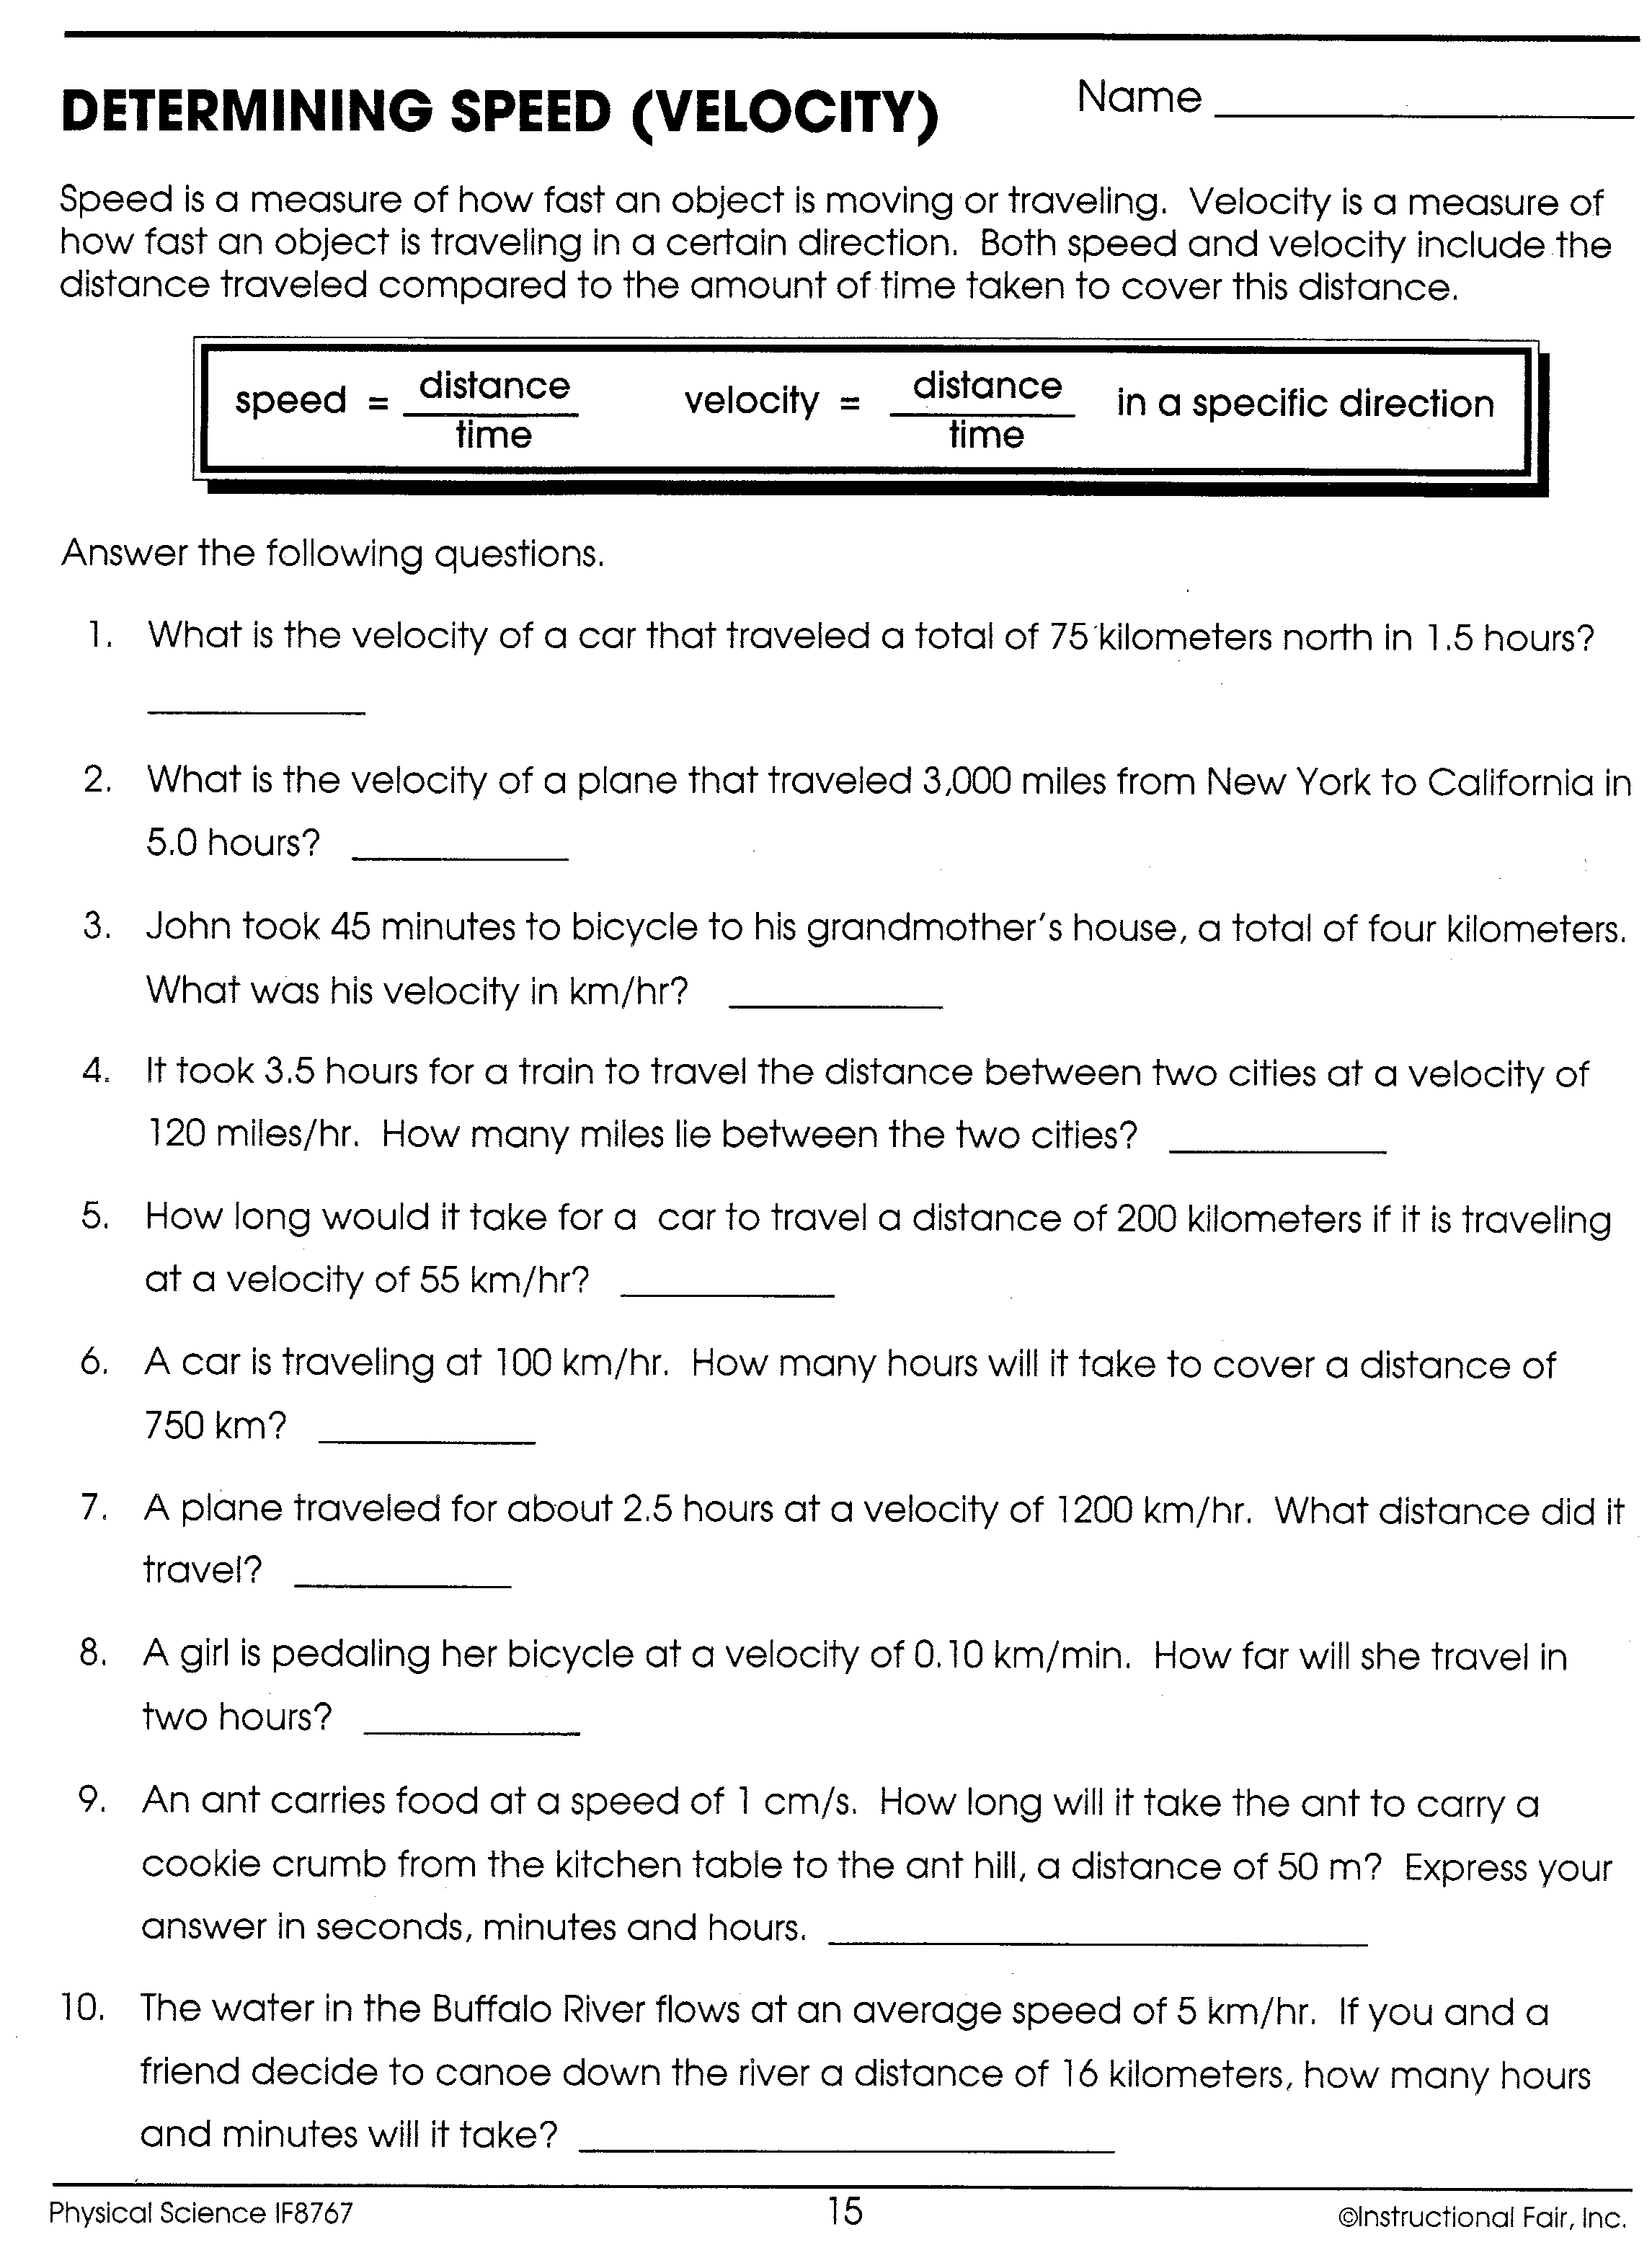
Speed And Velocity Practice Problems Worksheet Answers – Time Worksheets

www.timeworksheets.net
Velocity Time Graph Worksheet How To Find Average Speed On A Velocity

narodnatribuna.info
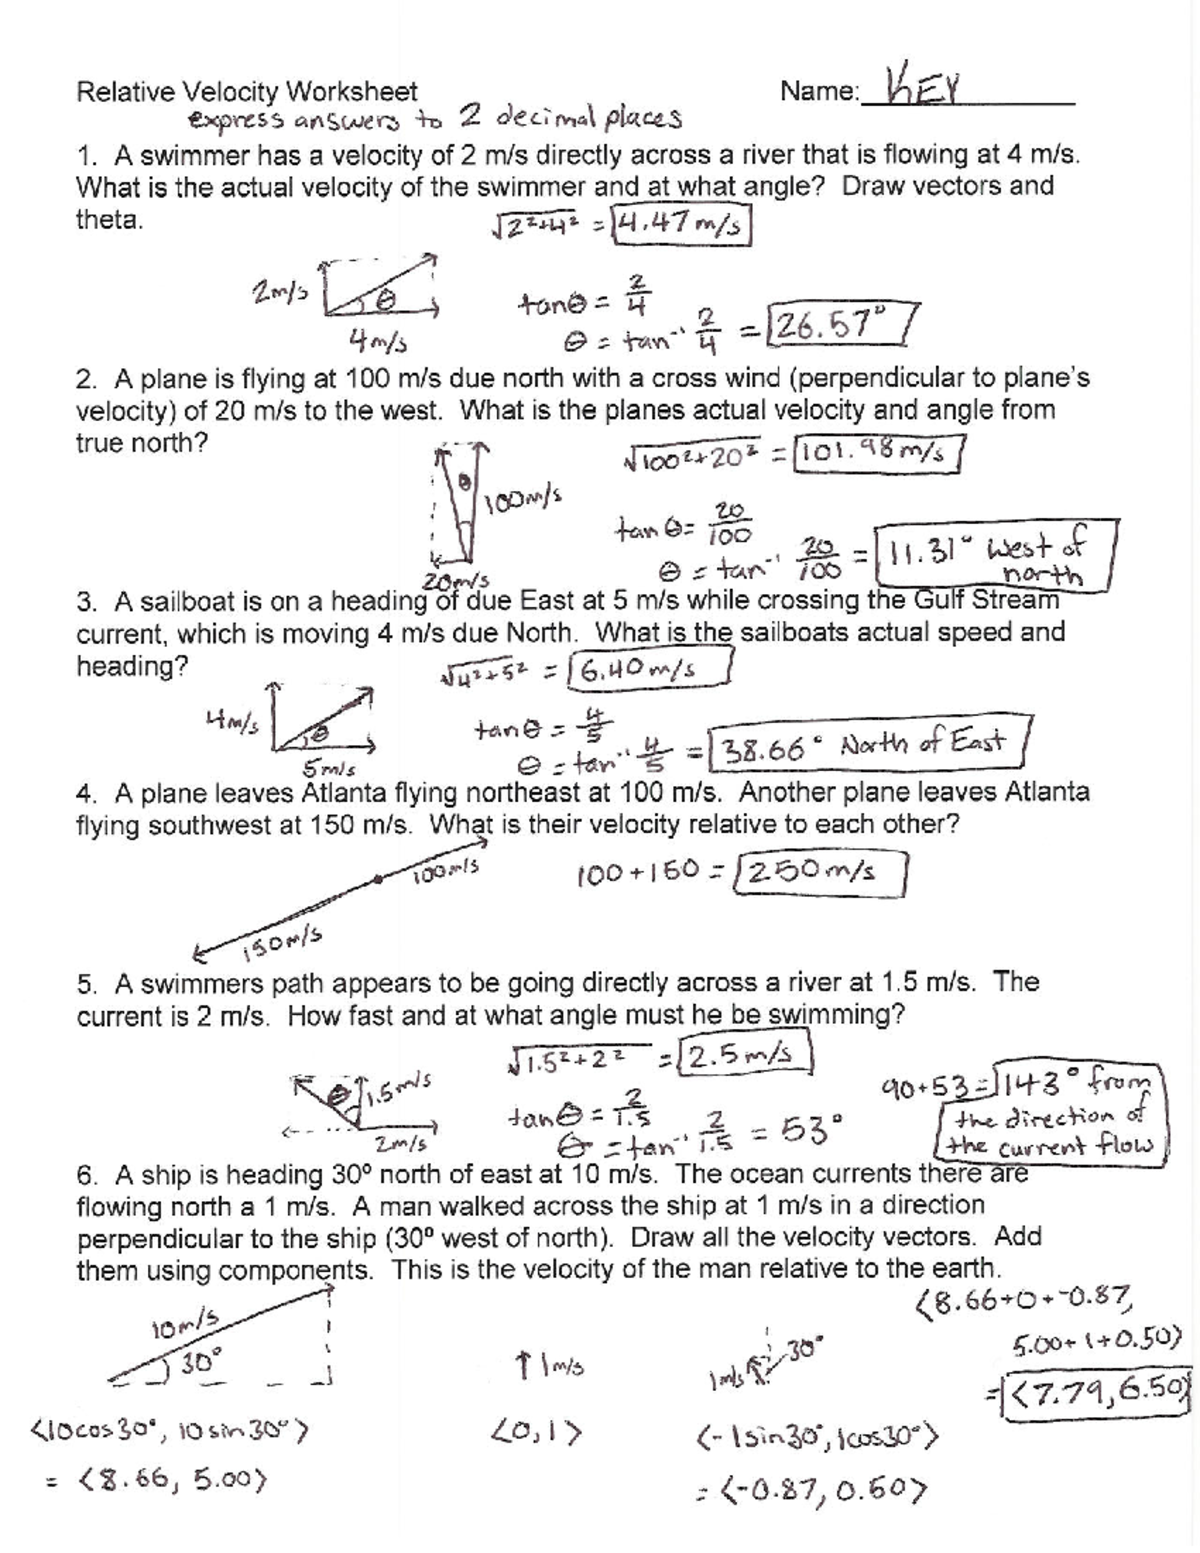
Relative Velocity Worksheet Key – Accountancy – Studocu
www.studocu.com
Velocity Time Graph Worksheet Answers
zipworksheet.com
Speed, Velocity And Acceleration | Teaching Resources – Worksheets

worksheets.clipart-library.com
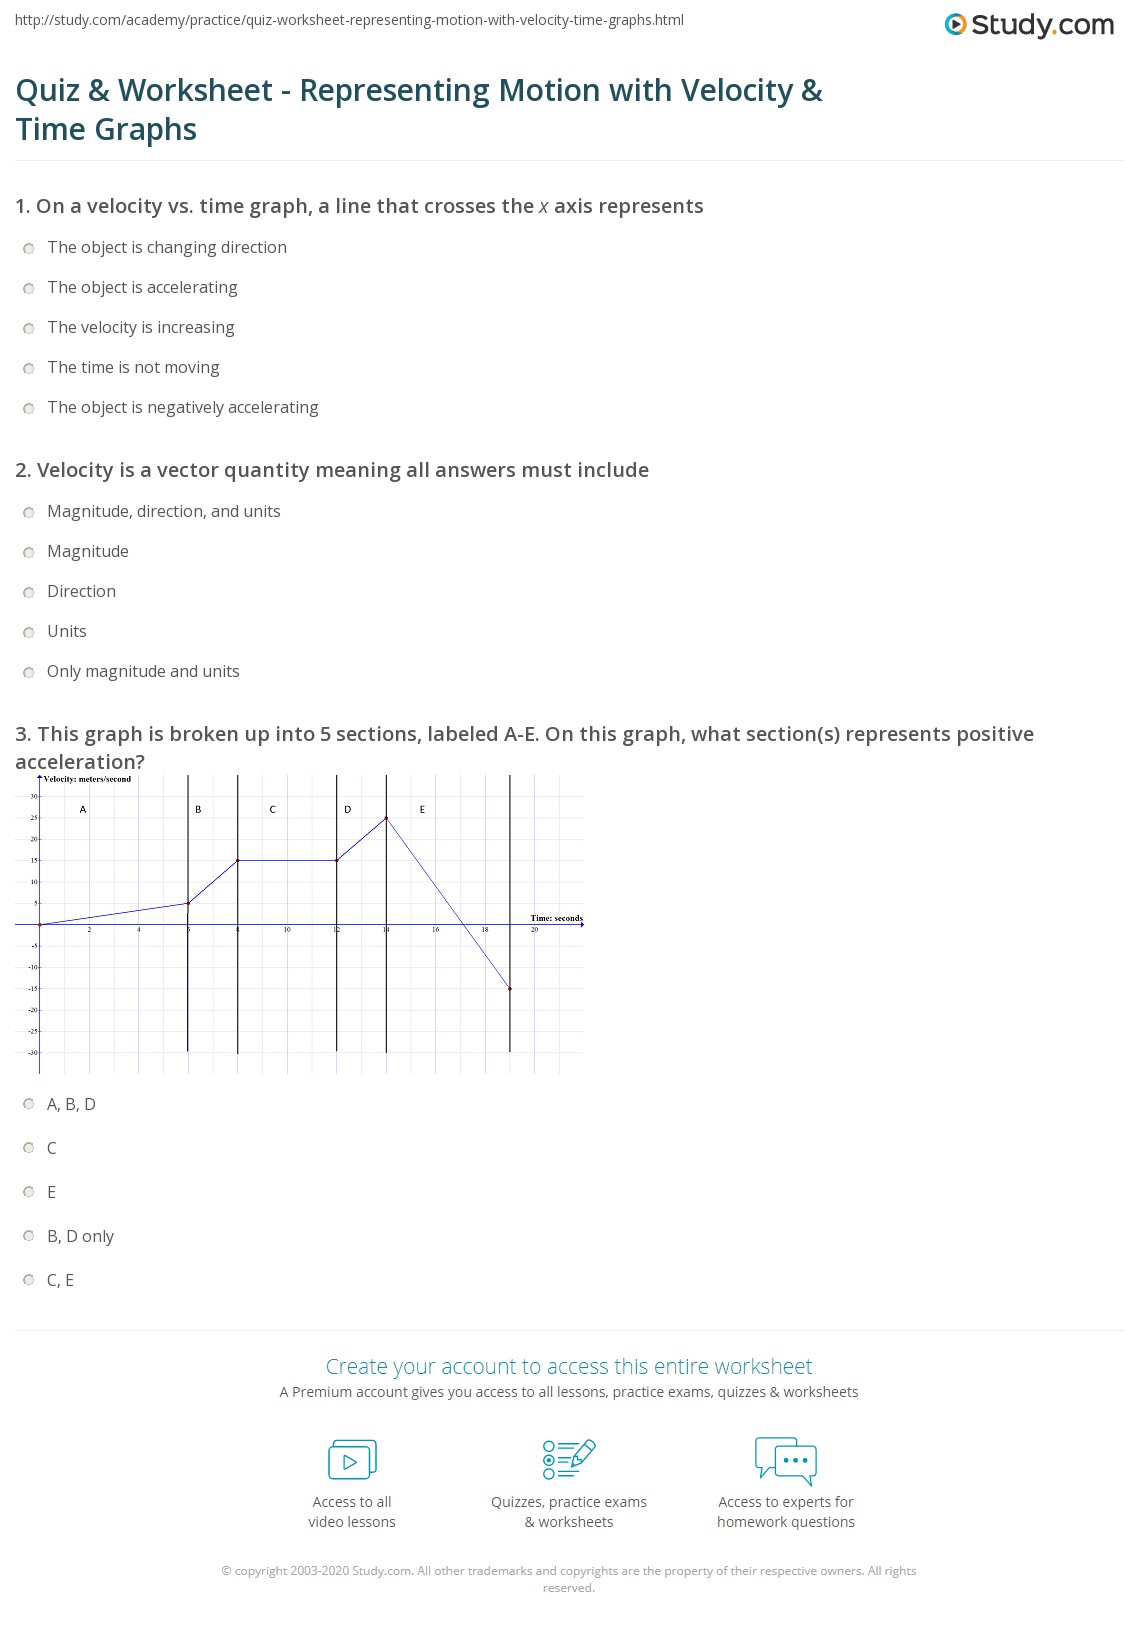
Study The Velocity Time Graph Pictured Below And Matc – Vrogue.co
www.vrogue.co
Velocity Time Graph Worksheet Answers – Ame.my.id
ame.my.id
Relative velocity worksheet key. Velocity-time graphs. Velocity time graph worksheet awesome uniformly accelerated particle