Are you ready to conquer the world of linear equations? Do the slopes and intercepts feel like a confusing jumble? Fear not! This is where the Graphing Linear Equations Worksheet comes to the rescue. It’s your friendly guide to understanding and mastering the art of plotting lines on a graph. It’s more than just lines on a paper; it is a way to represent relationships between variables and solve problems in the real world.
Think about it: from calculating distances to predicting sales trends, linear equations are everywhere. This worksheet provides the practice you need to not only understand the theoretical concepts, but also develop the practical skills to graph them accurately. It’s perfect for students learning about linear equations for the first time, or anyone who needs a refresher on the fundamentals.
These worksheets are designed to gradually build your skills. You’ll start with identifying key components of linear equations like the slope and y-intercept. Next, you will learn how to plot points, and connect these points to form lines. And finally, by the end, you’ll be graphing equations in slope-intercept form, point-slope form, and standard form with confidence.
Working through this worksheet isn’t just about finding the right answer; it’s about understanding the process. It’s about visualizing the relationship between x and y, and how changing the equation affects the appearance of the line on the graph. It’s about building a strong foundation for more advanced math concepts in the future. So grab your pencil, get your graph paper ready, and let’s dive into the world of graphing linear equations!
Understanding the Basics of Graphing Linear Equations
Before we jump into solving the problems, it’s crucial to understand the fundamental concepts behind graphing linear equations. A linear equation is simply an equation whose graph is a straight line. The most common form you’ll encounter is the slope-intercept form: y = mx + b. Let’s break it down:
- y: This represents the vertical coordinate on the graph.
- x: This represents the horizontal coordinate on the graph.
- m: This is the slope of the line, representing how steep it is. A positive slope means the line goes upwards from left to right, while a negative slope means it goes downwards. The slope is the ‘rise over run’ i.e. the change in y divided by the change in x.
- b: This is the y-intercept, which is the point where the line crosses the y-axis (when x = 0).
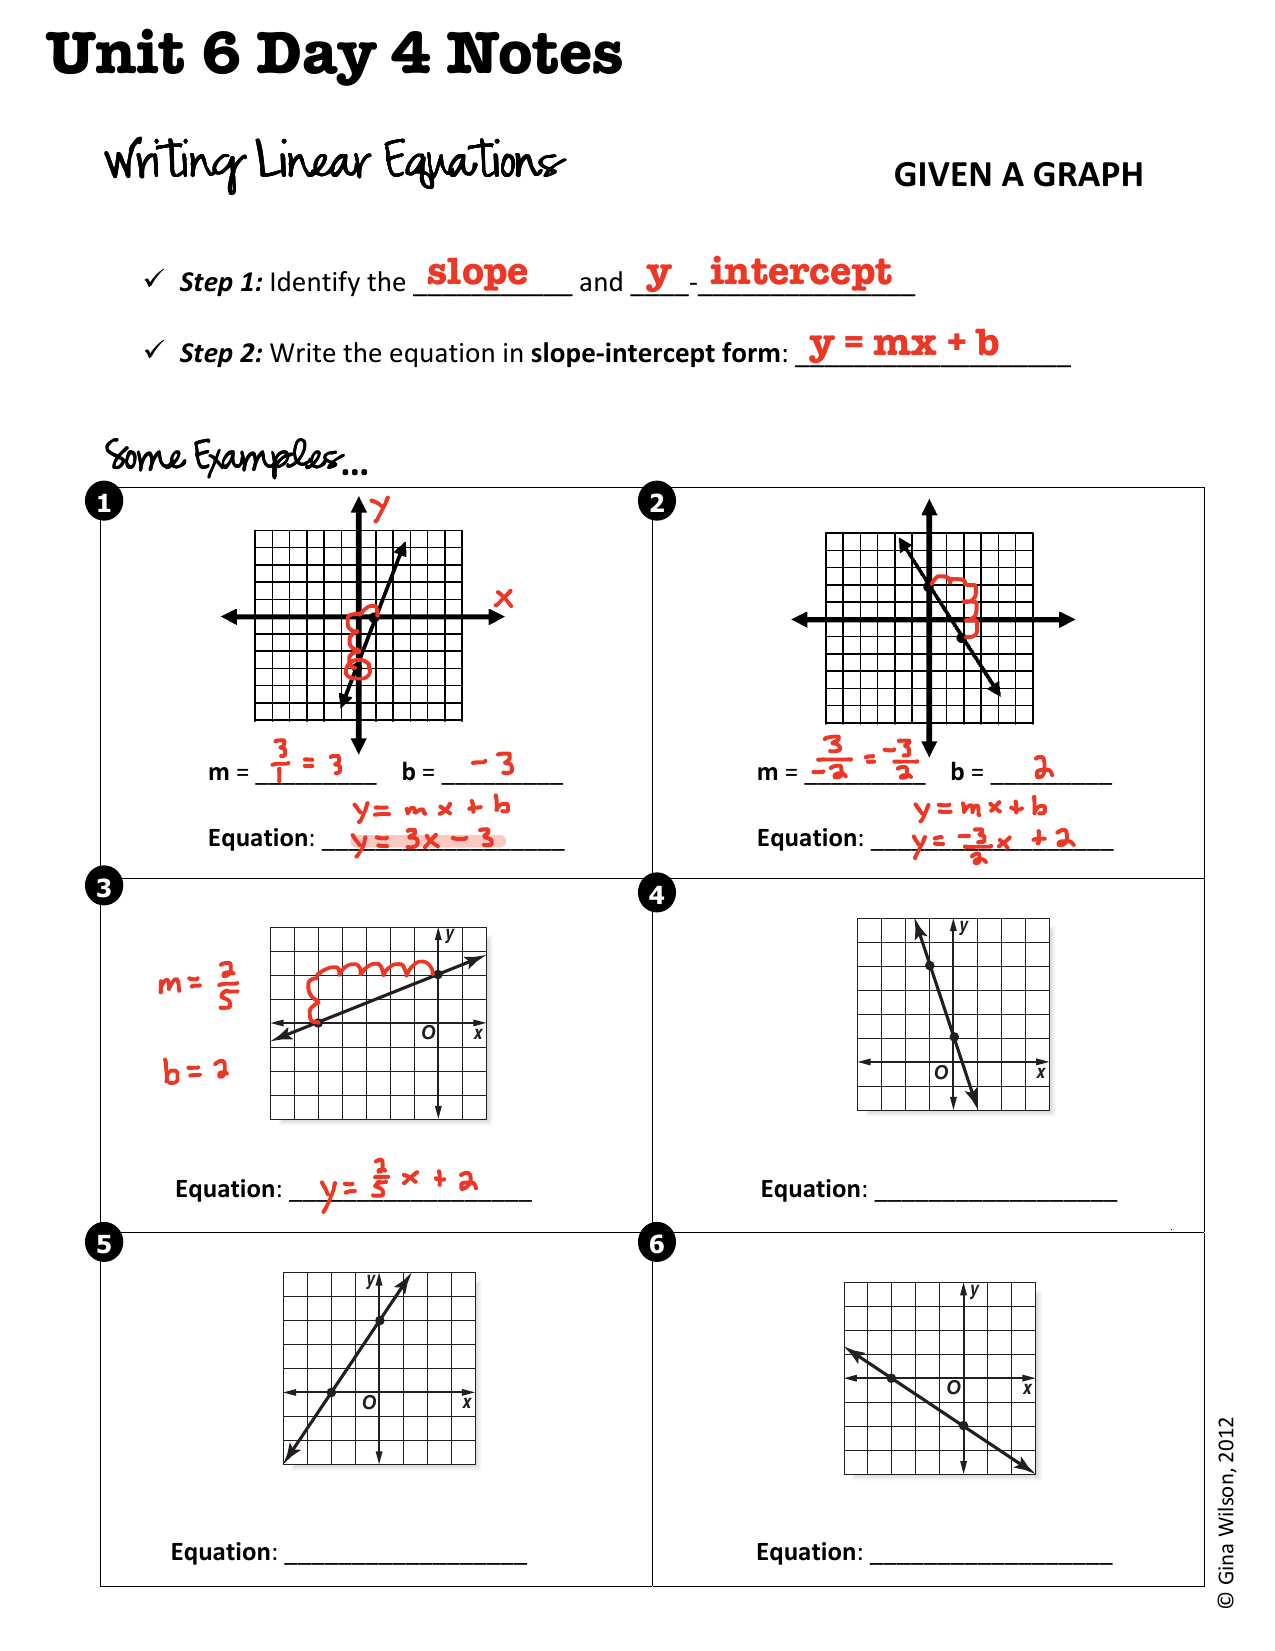
Another important concept is how to plot points on the graph. Each point is represented by an ordered pair (x, y). The x-coordinate tells you how far to move horizontally from the origin (0, 0), and the y-coordinate tells you how far to move vertically. Understanding these basics is key to successfully completing the worksheet.
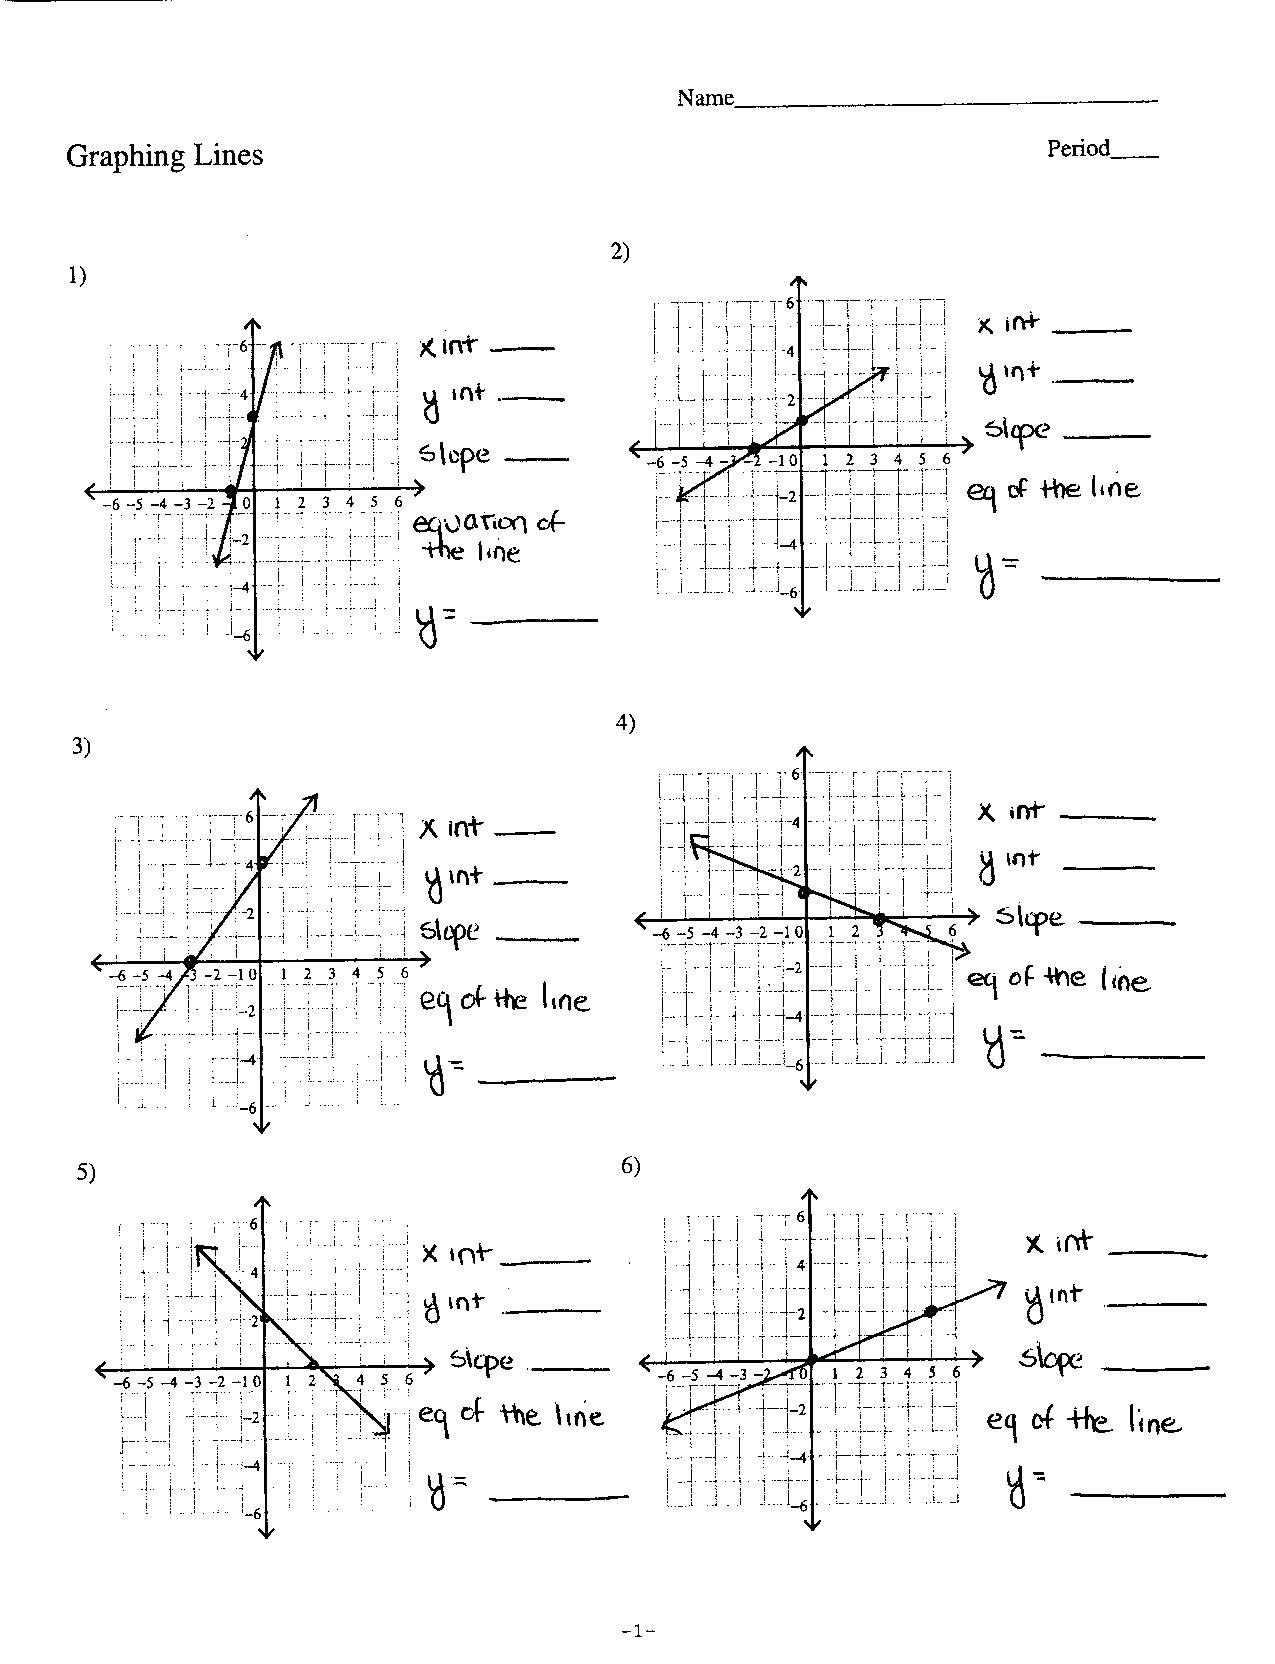
Answers to the Graphing Linear Equations Worksheet
Here is a solution set example for a sample worksheet. Please note that these are solutions for hypothetical problems. Your actual worksheet’s solutions will vary depending on the specific equations included. Below are examples with detailed steps to help understand the solution.
- Problem 1: Graph y = 2x + 1
- Step 1: Identify the slope and y-intercept. In this equation, m = 2 and b = 1.
- Step 2: Plot the y-intercept (0, 1) on the graph.
- Step 3: Use the slope to find another point. A slope of 2 means “rise 2, run 1”. So, from the y-intercept, move 1 unit to the right and 2 units up, and plot the point (1, 3).
- Step 4: Draw a straight line through the two points (0, 1) and (1, 3).
- Problem 2: Graph y = -x + 3
- Step 1: Identify the slope and y-intercept. In this equation, m = -1 and b = 3.
- Step 2: Plot the y-intercept (0, 3) on the graph.
- Step 3: Use the slope to find another point. A slope of -1 means “rise -1, run 1”. So, from the y-intercept, move 1 unit to the right and 1 unit down, and plot the point (1, 2).
- Step 4: Draw a straight line through the two points (0, 3) and (1, 2).
- Problem 3: Graph y = (1/2)x – 2
- Step 1: Identify the slope and y-intercept. In this equation, m = 1/2 and b = -2.
- Step 2: Plot the y-intercept (0, -2) on the graph.
- Step 3: Use the slope to find another point. A slope of 1/2 means “rise 1, run 2”. So, from the y-intercept, move 2 units to the right and 1 unit up, and plot the point (2, -1).
- Step 4: Draw a straight line through the two points (0, -2) and (2, -1).
- Problem 4: Graph x + y = 4 (Convert to slope-intercept form first)
- Step 1: Convert the equation to slope-intercept form (y = mx + b). Subtract x from both sides: y = -x + 4.
- Step 2: Identify the slope and y-intercept. In this equation, m = -1 and b = 4.
- Step 3: Plot the y-intercept (0, 4) on the graph.
- Step 4: Use the slope to find another point. A slope of -1 means “rise -1, run 1”. So, from the y-intercept, move 1 unit to the right and 1 unit down, and plot the point (1, 3).
- Step 5: Draw a straight line through the two points (0, 4) and (1, 3).
- Problem 5: Graph 2x – y = 1 (Convert to slope-intercept form first)
- Step 1: Convert the equation to slope-intercept form (y = mx + b). Subtract 2x from both sides: -y = -2x + 1. Multiply both sides by -1: y = 2x – 1.
- Step 2: Identify the slope and y-intercept. In this equation, m = 2 and b = -1.
- Step 3: Plot the y-intercept (0, -1) on the graph.
- Step 4: Use the slope to find another point. A slope of 2 means “rise 2, run 1”. So, from the y-intercept, move 1 unit to the right and 2 units up, and plot the point (1, 1).
- Step 5: Draw a straight line through the two points (0, -1) and (1, 1).
Remember to always double-check your work! Ensuring your points are accurately plotted and that your line is straight is essential for correct graphing. Good luck, and have fun!
If you are looking for Graphing Systems of Linear Equations Notes and Practice Worksheet you’ve visit to the right web. We have 20 Pictures about Graphing Systems of Linear Equations Notes and Practice Worksheet like Graphing Linear Equations Worksheets with Answer Key – Worksheets Library, Graphing Systems of Linear Equations Notes and Practice Worksheet and also Algebra 1 Worksheets Graphing Linear Equations. Here it is:
Graphing Systems Of Linear Equations Notes And Practice Worksheet

worksheets.clipart-library.com
18 Graphing Linear Equations Worksheets PDF – Free PDF At Worksheeto.com
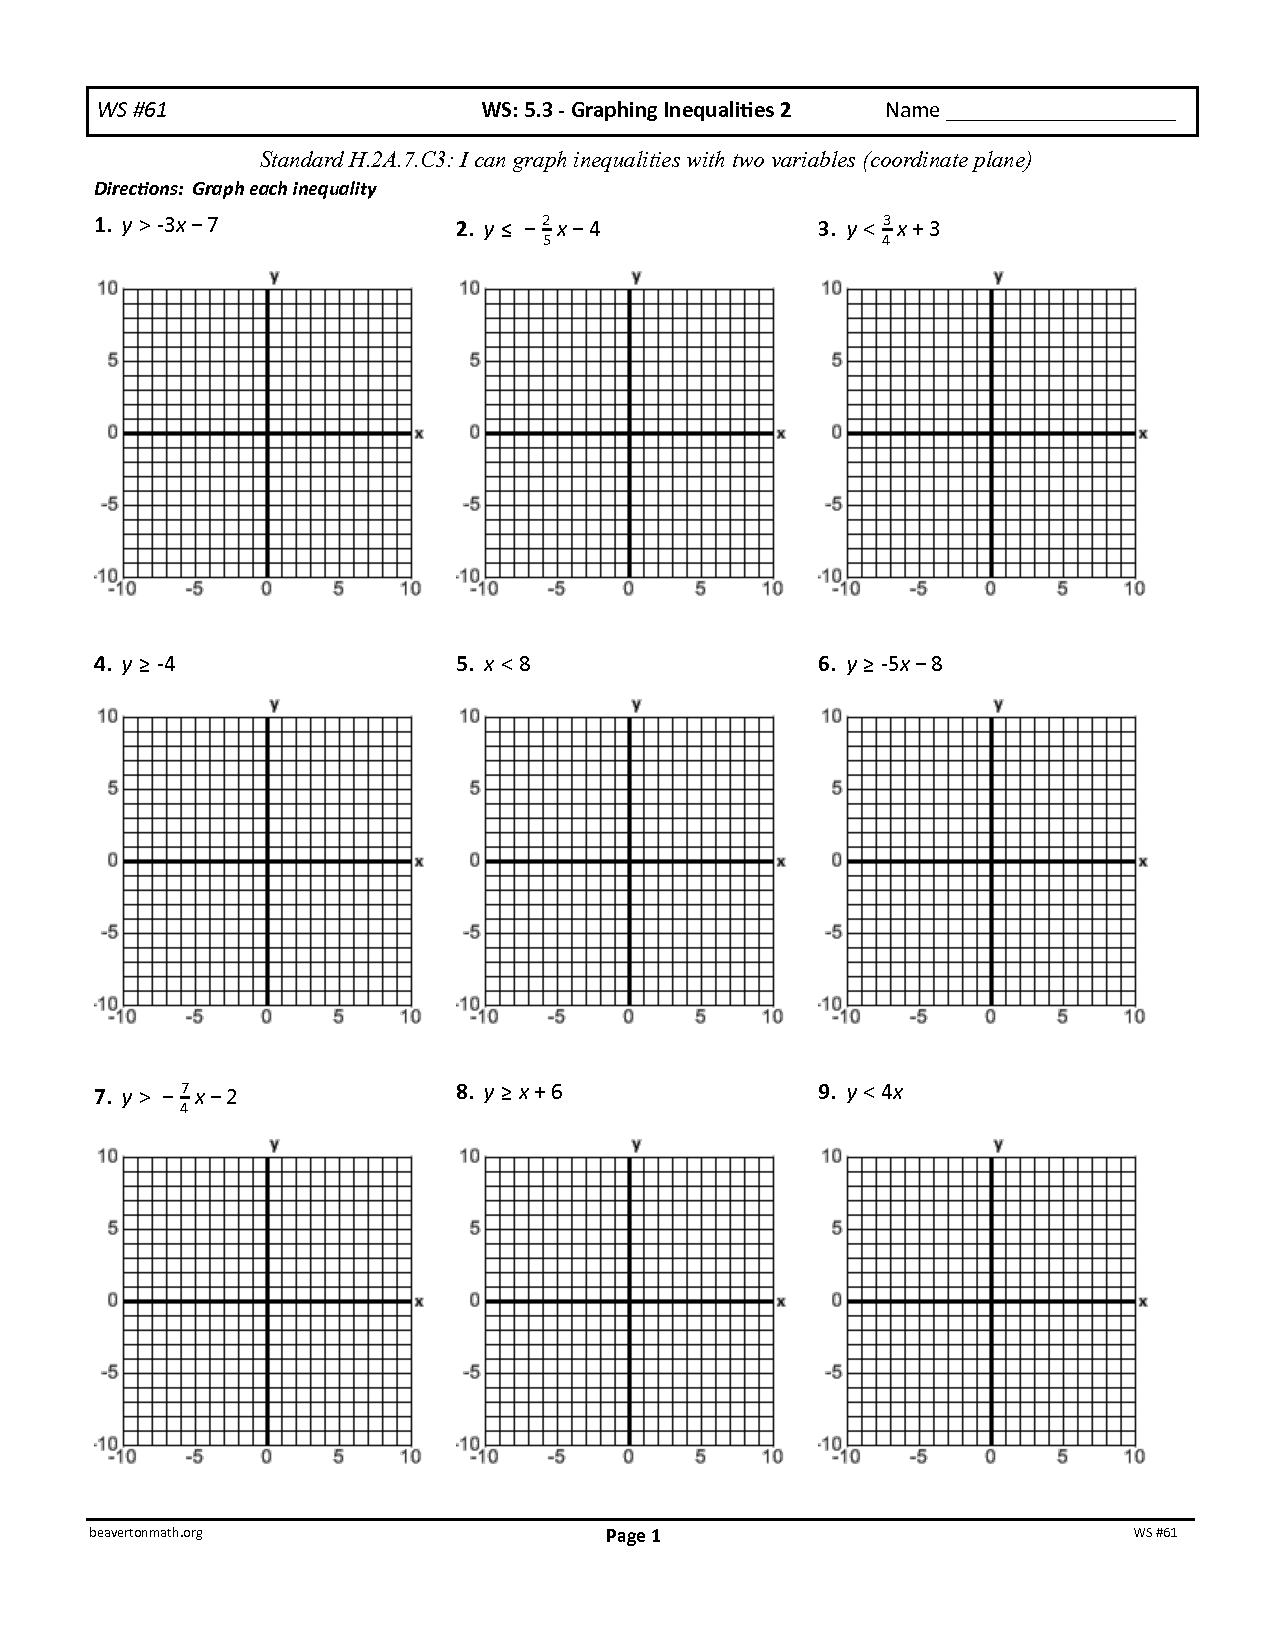
www.worksheeto.com
Graphing Linear Equations Worksheet PDF | USA – Worksheets Library
worksheets.clipart-library.com
Algebra 1 Worksheets Graphing Linear Equations

ar.inspiredpencil.com
Mastering Linear Equations: A Comprehensive Guide To Worksheets

www.worksheetsdigital.co
Edia | Free Math Homework In Minutes – Worksheets Library

worksheets.clipart-library.com
Graphing Linear Equations Worksheet With Answer Key
classdbgilbert.z21.web.core.windows.net
Graphing Linear Equation Worksheets – Worksheets Library
worksheets.clipart-library.com
Free Graphing Equations Worksheet Pdf, Download Free Graphing Equations
worksheets.clipart-library.com
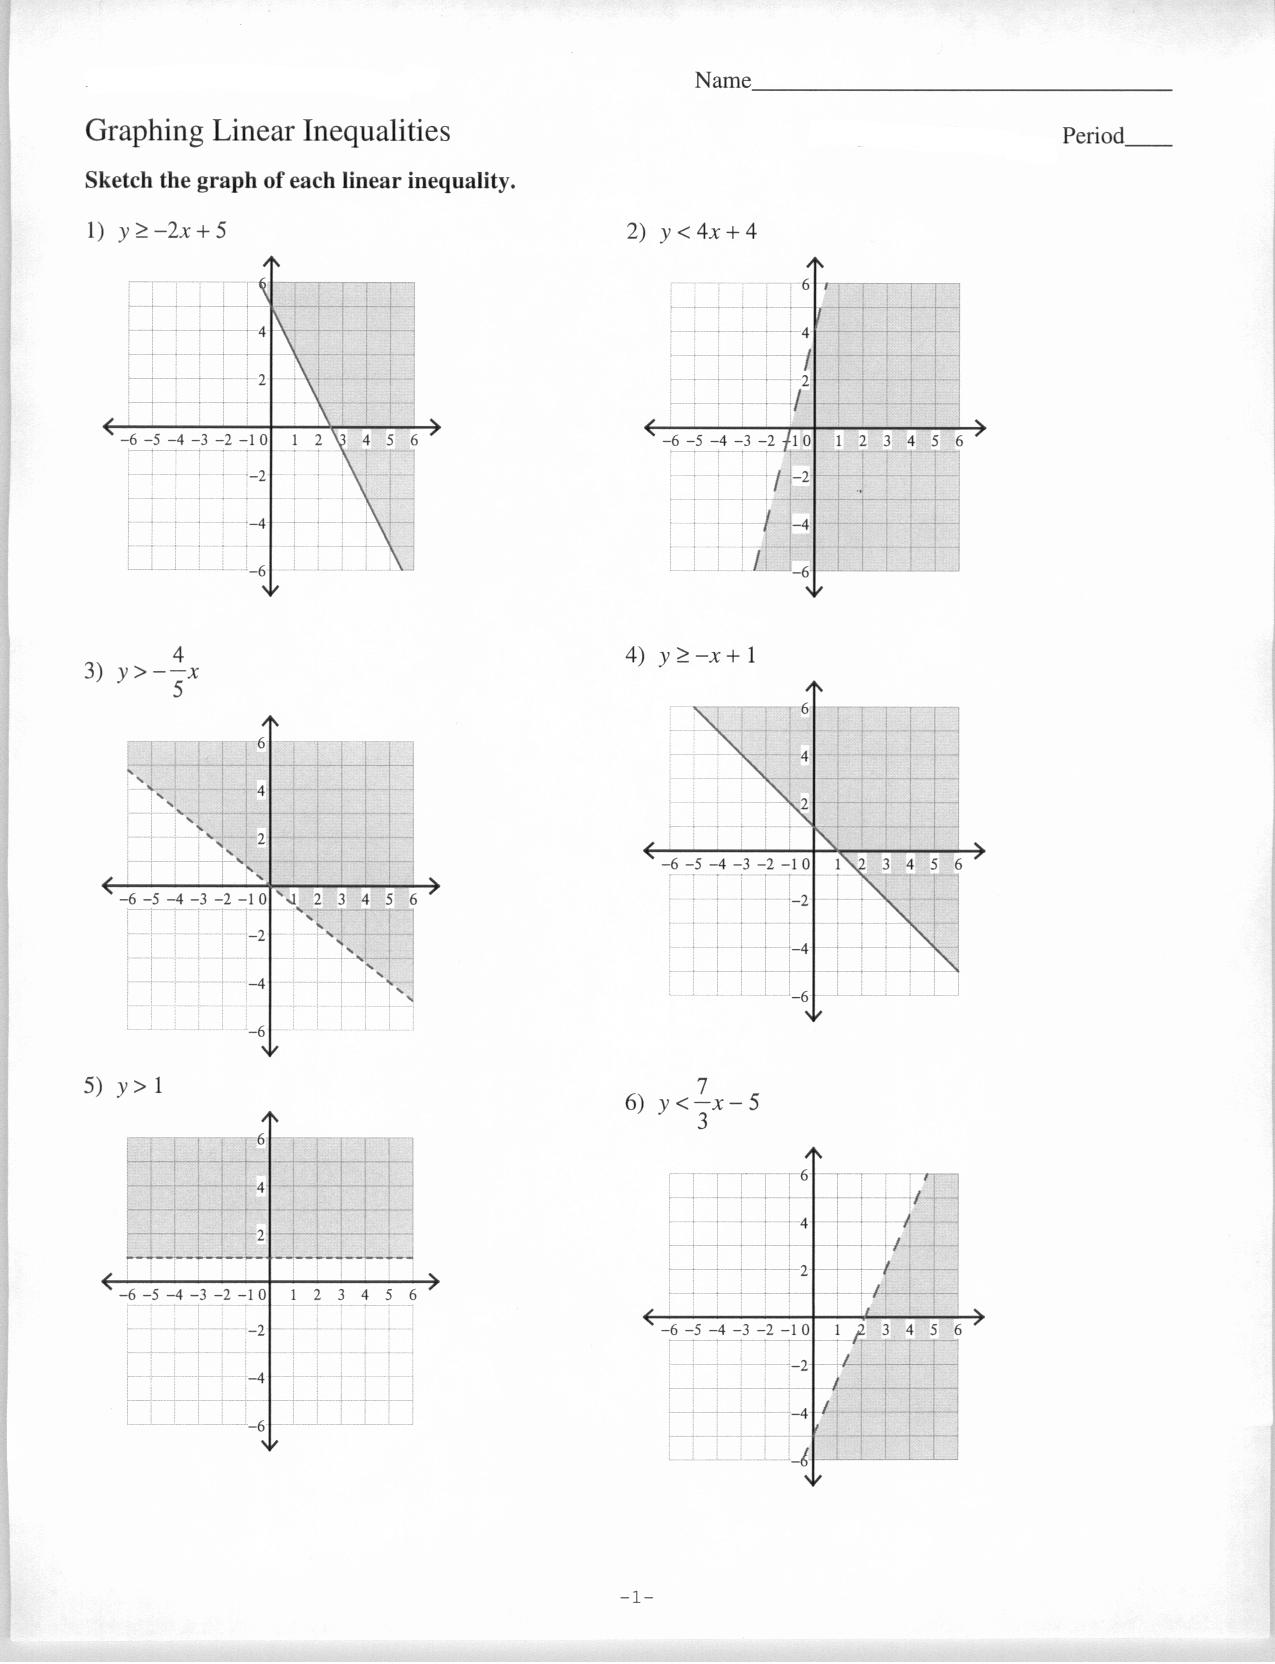
Linear Functions – Graphing Lines In Slope-Intercept Form Worksheets

www.madebyteachers.com
Graphing Linear Equations Worksheets With Answer Key – Worksheets Library

worksheets.clipart-library.com
Free Writing Linear Equations From Graphs Worksheet, Download Free

worksheets.clipart-library.com
Grade 10 Graphing Linear Equations Worksheets
lessondbcentrosome.z22.web.core.windows.net
Graphing Linear Equations Worksheet Algebra 2 Answers

www.worksheetsdigital.co
Graphing Linear Equations Practice Worksheet Unique Quiz & Worksheet
chessmuseum.org
Graphing Linear Equations Practice Worksheet – Owhentheyanks.com
www.owhentheyanks.com
Solving Equations By Graphing Worksheet

ar.inspiredpencil.com
Graphing Linear Equations In Slope Intercept And Standard Form
www.functionworksheets.com
Free Linear Equations Worksheet, Download Free Linear Equations

worksheets.clipart-library.com
Language Arts Worksheets – Worksheets Library

worksheets.clipart-library.com
Graphing linear equations worksheet pdf. graphing linear equations worksheet pdf. linear functions