Hey there, math mavens! Are you ready to conquer the world of linear equations, one graph at a time? Then you’ve come to the right place! Today, we’re diving deep into the wonderful world of slope-intercept form and how mastering it can unlock a whole new level of graphing prowess. We’re talking about making those lines dance across your graph paper with precision and understanding. Forget rote memorization; we’re aiming for true comprehension. And what better way to solidify your understanding than with a trusty worksheet? Let’s get started!
Understanding Slope-Intercept Form
Before we jump into the worksheet, let’s refresh our understanding of slope-intercept form itself. The magical equation we’re working with is: y = mx + b. Each part plays a crucial role in defining the line.
- y: This represents the vertical coordinate on the graph.
- x: This represents the horizontal coordinate on the graph.
- m: Ah, the mighty slope! This tells us how steep the line is and its direction (whether it’s going up or down from left to right). It’s often described as “rise over run” – the change in y divided by the change in x. A positive slope indicates an upward trend, while a negative slope signifies a downward trend. A slope of zero represents a horizontal line.
- b: This is the y-intercept, the point where the line crosses the y-axis. It’s the value of y when x is equal to 0. It provides a starting point for graphing the line.
Knowing these components allows you to quickly visualize and graph any equation in slope-intercept form. You can pinpoint where the line begins on the y-axis (the y-intercept) and then use the slope to guide you to the next point on the line. It’s like having a secret code to unlock the mysteries of linear equations!
Why is Slope-Intercept Form Important?
Slope-intercept form is more than just a mathematical equation; it’s a powerful tool for understanding and representing real-world relationships. Many real-life scenarios can be modeled using linear equations. For example:
- Calculating Costs: The total cost of renting a car might be represented as y = (cost per mile)x + (base rental fee).
- Predicting Growth: A plant’s growth over time can be modeled linearly, where ‘m’ represents the growth rate and ‘b’ represents the initial height.
- Analyzing Motion: The distance traveled by a moving object at a constant speed can be expressed in slope-intercept form, where ‘m’ is the speed and ‘b’ is the initial position.
By mastering slope-intercept form, you’re not just learning a math concept; you’re developing valuable skills for analyzing and understanding the world around you.
Graphing with Slope-Intercept Form: A Step-by-Step Guide
Here’s a breakdown of how to graph an equation in slope-intercept form using a worksheet:
- Identify ‘m’ and ‘b’: Look closely at the equation and determine the values of the slope (m) and the y-intercept (b).
- Plot the Y-Intercept: On your graph paper, find the point that corresponds to the y-intercept (b). This is where your line will cross the y-axis. Mark this point clearly.
- Use the Slope to Find Another Point: Remember, the slope (m) is rise over run. Starting from the y-intercept, use the slope to find another point on the line. For example, if the slope is 2/3, move up 2 units (the rise) and right 3 units (the run) from the y-intercept. Plot this new point. If the slope is negative, you’ll move down instead of up.
- Draw the Line: Now that you have two points, use a ruler or straightedge to draw a line that passes through both points. Extend the line across the entire graph.
- Double-Check: Choose another point on the line and see if its coordinates satisfy the original equation. This helps you confirm that you’ve graphed the line correctly.
Practice makes perfect! The more you work with graphing worksheets, the more confident you’ll become. Don’t be afraid to make mistakes; they’re a valuable learning opportunity.
Now, for a practice problem. Let’s graph the equation y = 2x + 1
- m = 2 (or 2/1, making the rise 2 and the run 1)
- b = 1 (the y-intercept is at the point (0, 1))
First, plot the y-intercept at (0, 1). Then, from that point, go up 2 units and to the right 1 unit. That puts you at the point (1, 3). Now you can draw a straight line passing through (0, 1) and (1, 3). Voila! You’ve graphed your first line!
Answers to a Sample Graphing Slope-Intercept Form Worksheet
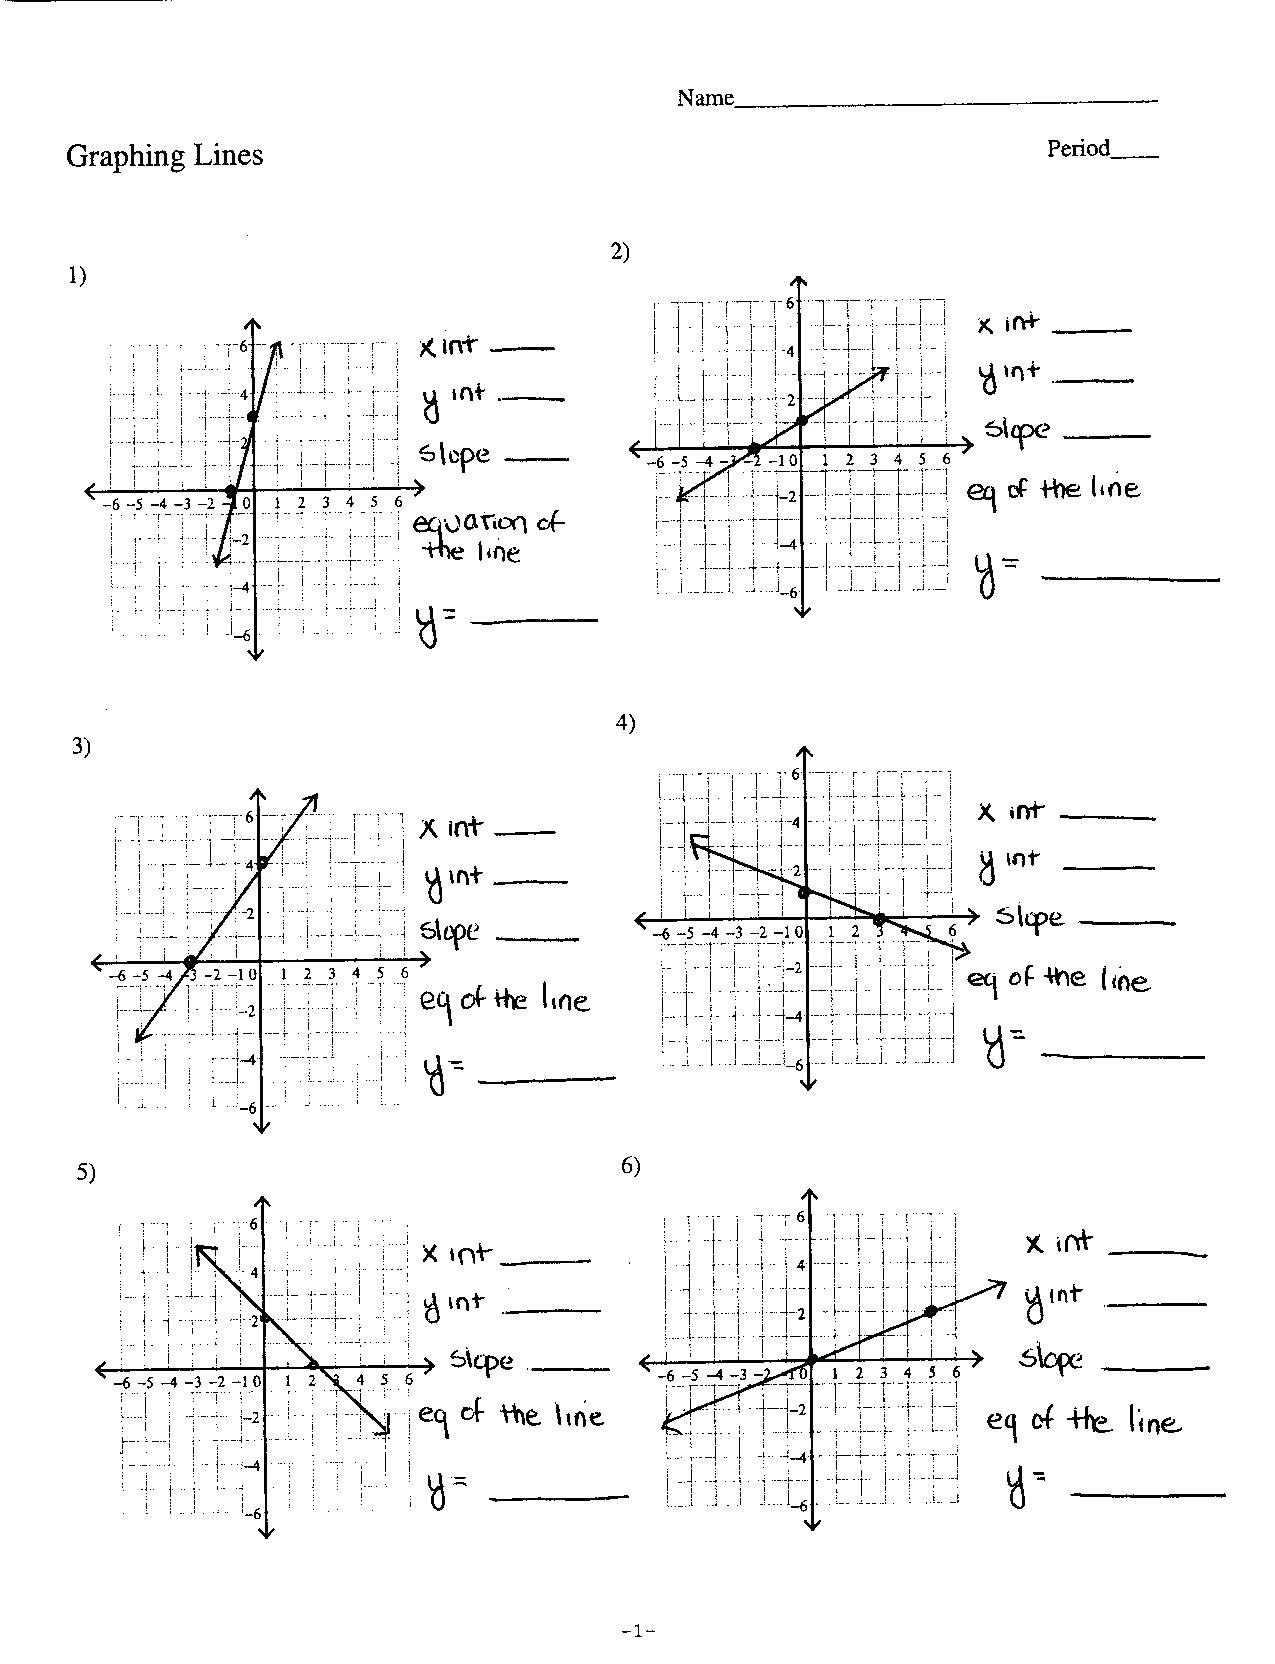
Here are possible solutions to common types of problems you might find on a graphing slope-intercept form worksheet. Remember that graphing needs to be done on a graph. The information below is simply providing the important parts of the problem and the results!
- Problem: Graph y = x + 2.
- Slope: 1
- Y-intercept: 2
- Problem: Graph y = -3x – 1.
- Slope: -3
- Y-intercept: -1
- Problem: Graph y = (1/2)x + 3.
- Slope: 1/2
- Y-intercept: 3
- Problem: Graph y = – (2/3)x + 0
- Slope: -2/3
- Y-intercept: 0
- Problem: Graph y = 4
- Slope: 0
- Y-intercept: 4
- Problem: Write the equation of the line with a slope of 2 and a y-intercept of -5.
- Equation: y = 2x – 5
- Problem: Write the equation of the line with a slope of -1 and a y-intercept of 3.
- Equation: y = -x + 3
This is just a small sample. There are many variations you might encounter. The key is to understand the relationship between the slope, y-intercept, and the resulting line on the graph. Happy graphing!
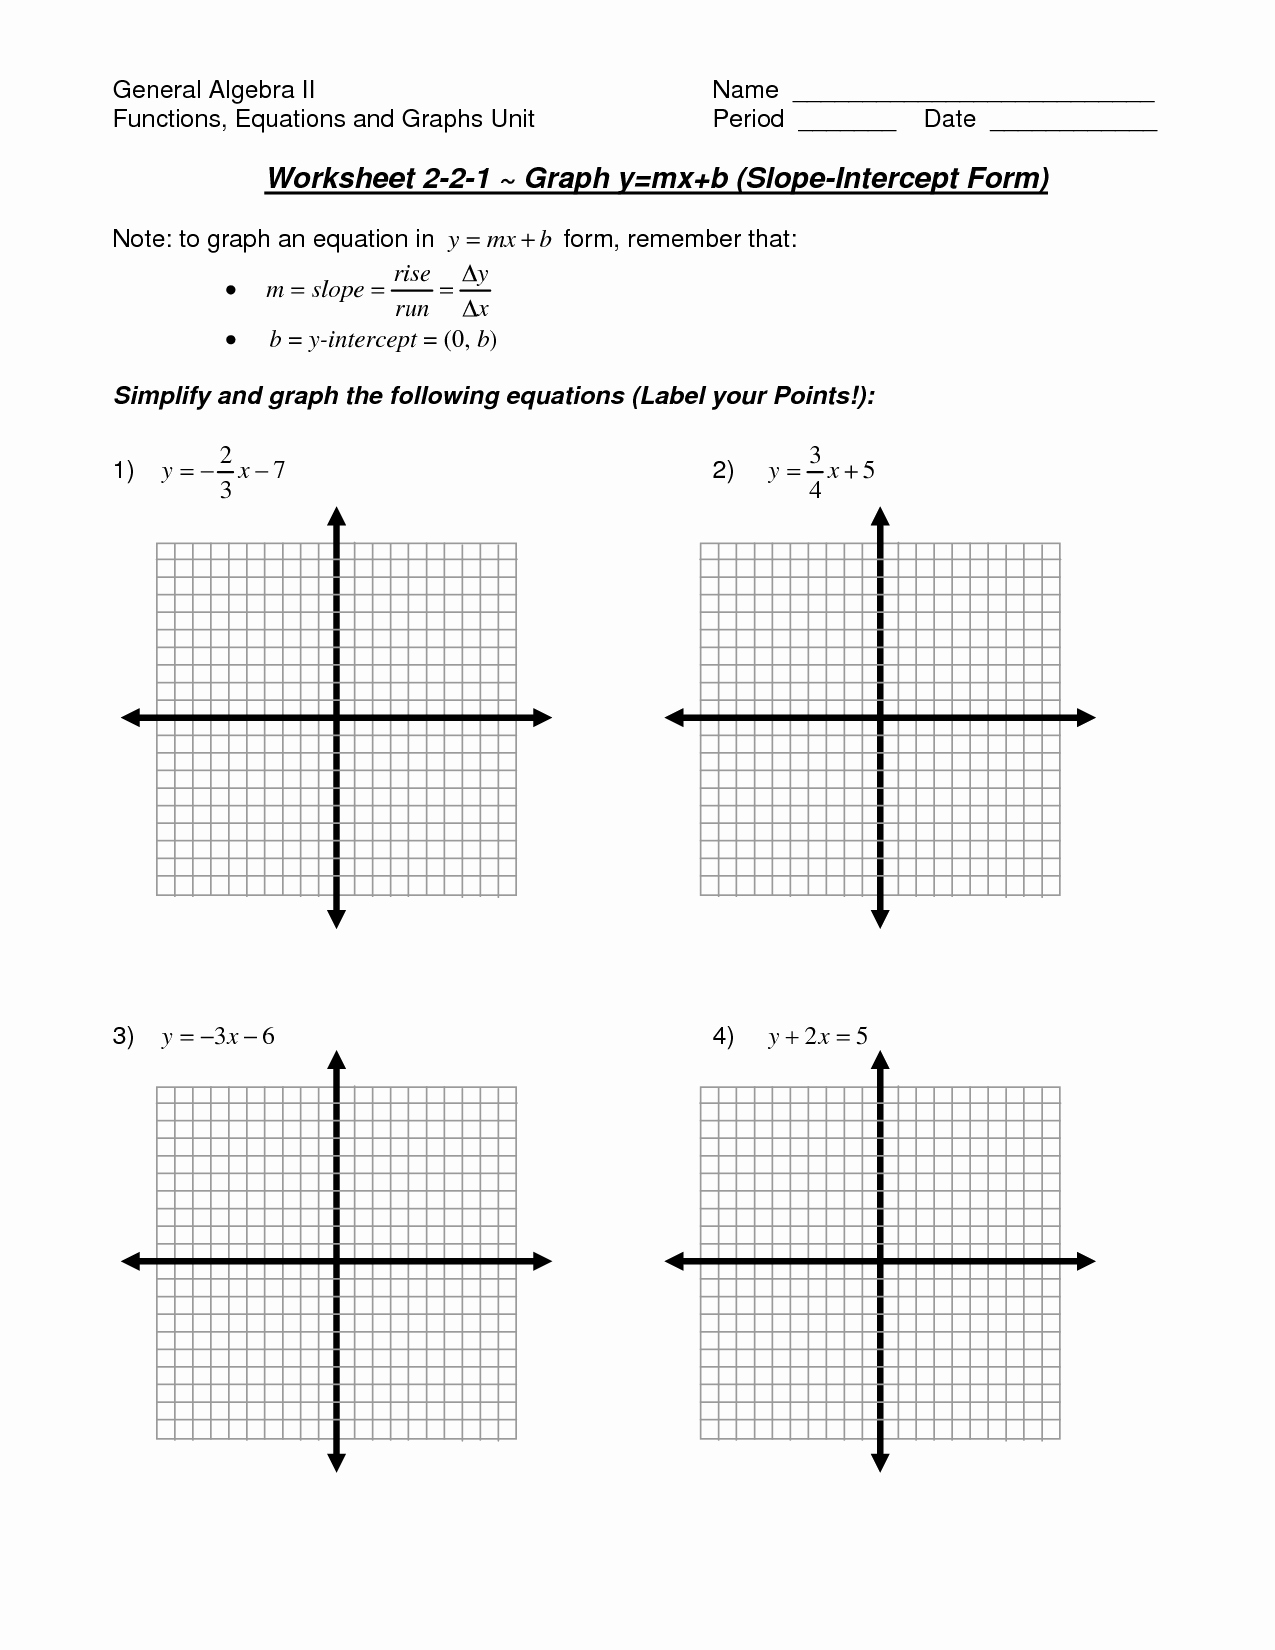
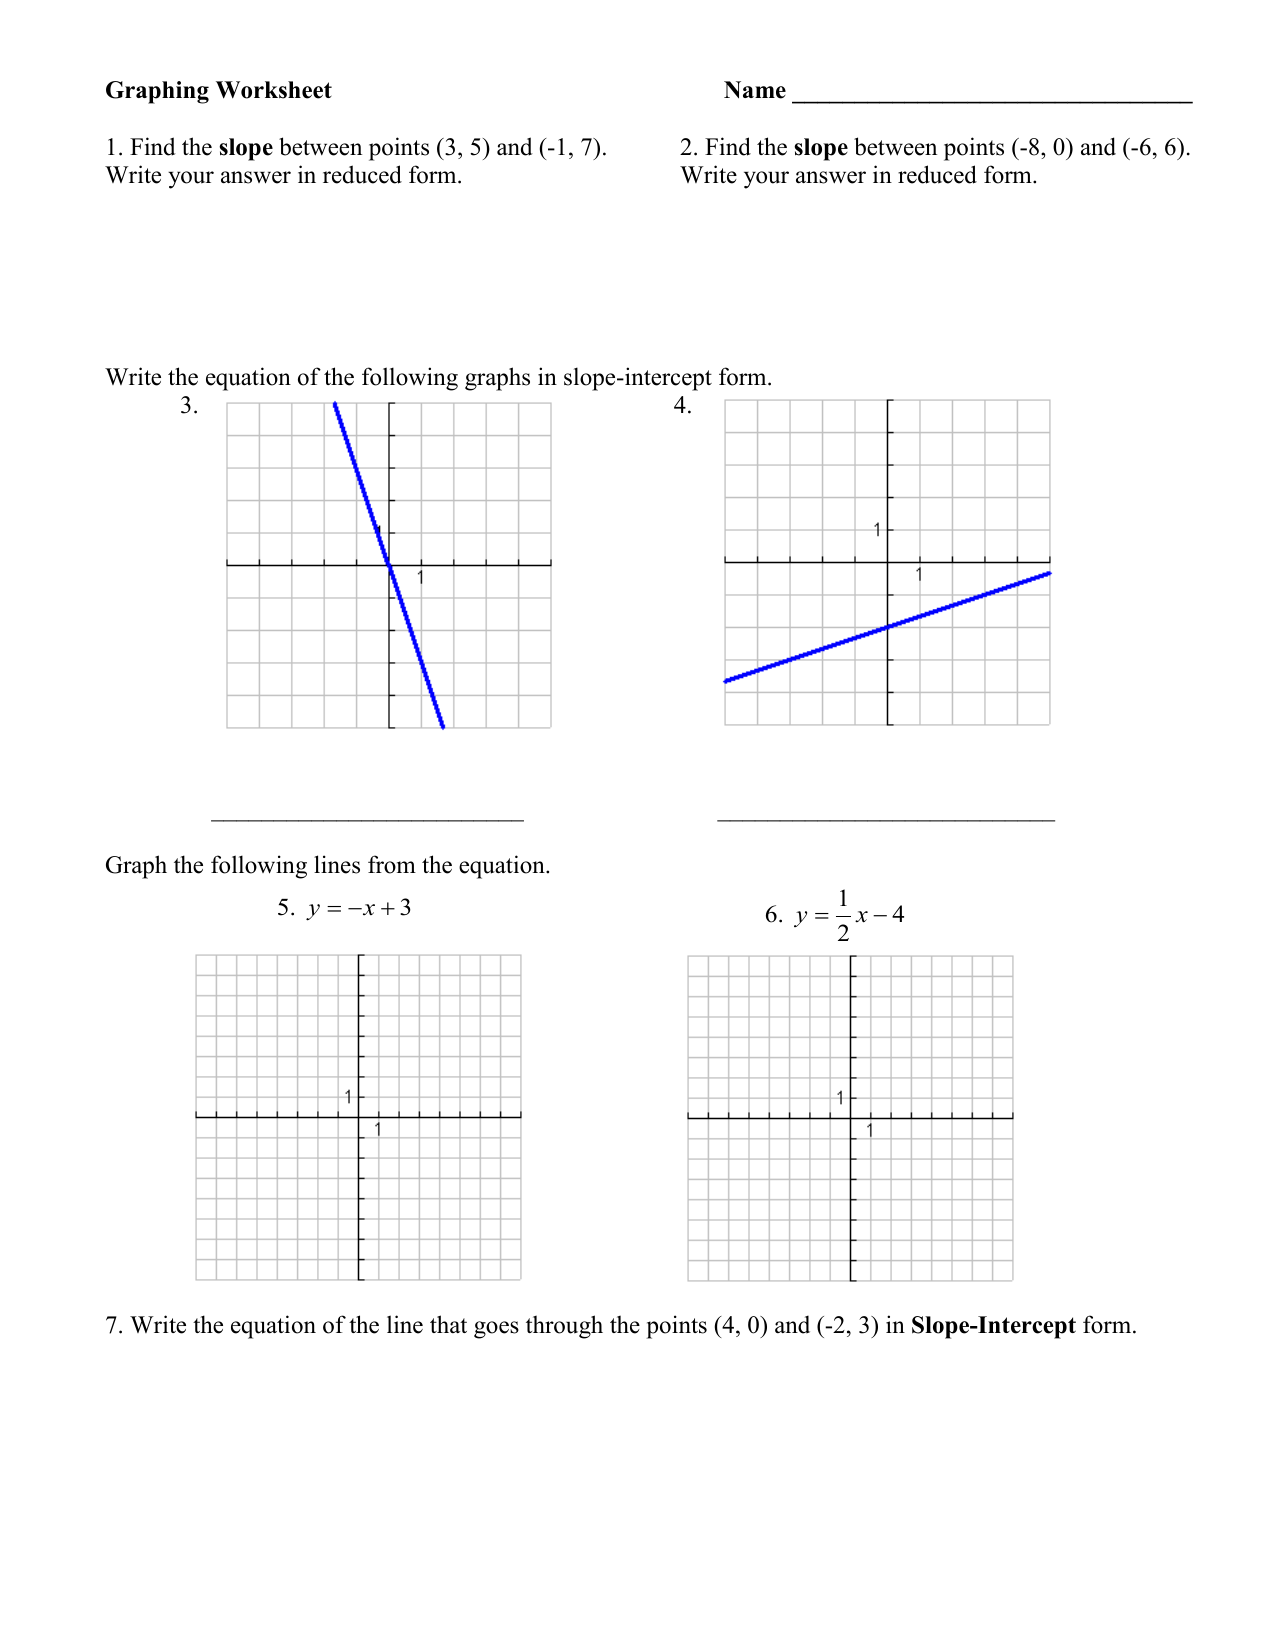
If you are searching about Linear Functions – Finding Slope and Y-intercept from an Equation you’ve came to the right page. We have 20 Pics about Linear Functions – Finding Slope and Y-intercept from an Equation like Graphing Slope Intercept form Worksheet Fresh Slope Intercept form, Graphing Slope Intercept Form Worksheet – Pro Worksheet and also Graphing Slope Intercept Form Worksheet – Pro Worksheet. Here you go:
Linear Functions – Finding Slope And Y-intercept From An Equation

www.madebyteachers.com
Graphing Slope Intercept Form Activities – Anna Kellys Creations

worksheets.clipart-library.com
Linear Functions – Graphing Lines In Slope-Intercept Form Worksheets

www.madebyteachers.com
Graphing Slope Intercept Form Worksheet Fresh Slope Intercept Form
chessmuseum.org
Free Write An Equation In Slope Intercept Form Worksheet, Download Free

worksheets.clipart-library.com
Graphing Slope Intercept Form Worksheet – Pro Worksheet
www.proworksheet.my.id
Graphing Linear Equations Slope Intercept Form Worksheet

classpritchard99.s3-website-us-east-1.amazonaws.com
Types Of Slope Worksheet – Free Worksheets Printable

lisaworksheets.com
Slope And Slope Intercept Form Worksheet – Slope Intercept Form

worksheets.clipart-library.com
Graphing Slope Intercept Form Worksheet – Pro Worksheet
www.proworksheet.my.id
Week 7 Homework Adv Math- Graphing Lines In Slope-Intercept Form

worksheets.clipart-library.com
Slope Intercept Form From Two Points Worksheet – Vrogue.co
-Step-24-Version-2.jpg)
www.vrogue.co
Graphing Slope Intercept Form Worksheet – E-streetlight.com

www.e-streetlight.com
Slope Intercept Form Graphing Worksheet – Printable And Enjoyable Learning

newark2.remotepc.com
Graphing Slope Intercept Form ≡ Fill Out Printable PDF Forms Online

worksheets.clipart-library.com
Free Graphing Slope Intercept Worksheet, Download Free Graphing Slope
worksheets.clipart-library.com
Graphing Linear Equations Slope Intercept Form Collaborative

maliarivera.com
Linear Functions – Graphing Lines In Slope-Intercept Form Worksheets

worksheets.clipart-library.com
Slope Intercept Form Graphing Worksheet

ar.inspiredpencil.com
Graphing Linear Equations In Slope Intercept And Standard Form
www.functionworksheets.com
Slope intercept form graphing worksheet. Linear functions. graphing linear equations slope intercept form worksheet