Understanding motion is fundamental to physics, and one of the best ways to visualize and analyze motion is through position-time graphs. These graphs, which plot an object’s position against time, provide a wealth of information about its movement – velocity, acceleration, and direction. Mastering the interpretation of position-time graphs is crucial for students taking introductory physics courses, and that’s where a well-designed worksheet comes in handy.
A position-time graph worksheet typically presents a series of graphs, each depicting different scenarios of motion. Students are then asked to answer questions based on these graphs, such as determining the object’s displacement over a specific time interval, calculating its average velocity, identifying periods of constant velocity or acceleration, and even inferring the direction of motion. These worksheets are invaluable tools for reinforcing concepts learned in the classroom and for developing problem-solving skills.
The beauty of position-time graphs lies in their simplicity. A straight line on the graph indicates constant velocity; a steeper line indicates a higher velocity; and a horizontal line indicates that the object is at rest. Curved lines represent acceleration or deceleration. By carefully analyzing the shape and slope of the graph, students can gain a comprehensive understanding of the object’s motion without needing complex mathematical equations.
Successfully completing a position-time graph worksheet requires a solid grasp of key concepts such as displacement, velocity, and the relationship between them. It also involves developing critical thinking skills to interpret the graphical representation of motion. Furthermore, practice with these worksheets builds confidence in students’ ability to tackle more complex problems in kinematics. By the end of a well-designed worksheet, students should be able to not only extract information from a position-time graph but also create one from a given scenario.
To illustrate the types of questions a position-time graph worksheet might contain, consider the following examples. A graph shows a car moving away from a starting point at a constant rate, then stopping for a period, and then returning to the starting point at a slower rate. A student might be asked to determine the total distance traveled by the car, the time it spent stationary, and its average speed during the return journey. Solving these problems reinforces the understanding of how these concepts are visually represented on the graph.
Now, let’s dive into some example answers you might find on a position-time graph worksheet. Keep in mind that the specific questions and answers will vary depending on the worksheet design and the graphs presented.
Position Time Graph Worksheet: Example Answers
Here are some example answers formatted for easy readability. The specific answers will depend entirely on the graphs provided in the worksheet. These are illustrative examples.
-
Question 1: What is the object’s displacement between t = 2 seconds and t = 5 seconds?
Answer: The object’s position at t = 2s is 4 meters, and its position at t = 5s is 10 meters. Therefore, the displacement is 10 meters – 4 meters = 6 meters.
-
Question 2: What is the object’s average velocity between t = 0 seconds and t = 4 seconds?
Answer: The object’s position at t = 0s is 0 meters, and its position at t = 4s is 8 meters. The change in time is 4s – 0s = 4s. Therefore, the average velocity is (8 meters) / (4 seconds) = 2 meters/second.
-
Question 3: During what time interval is the object at rest?
Answer: The object is at rest between t = 6 seconds and t = 8 seconds. This is indicated by the horizontal line on the graph during this interval, meaning the position is not changing.
-
Question 4: Is the object moving with constant velocity between t = 1 second and t = 3 seconds? If so, what is its velocity?
Answer: Yes, the object is moving with constant velocity between t = 1s and t = 3s. The slope of the line is constant during this interval. Its position at t = 1s is 2 meters, and its position at t = 3s is 6 meters. The change in time is 3s – 1s = 2s. Therefore, its velocity is (6 meters – 2 meters) / (2 seconds) = 2 meters/second.
-
Question 5: At what time(s) does the object change direction?
Answer: The object changes direction at t=4 seconds and t=8 seconds. This is indicated by a change in the slope of the graph from positive to negative, or vice-versa. A change in slope implies a change in the velocity’s sign, therefore a change in the direction of motion.
-
Question 6: Calculate the total distance travelled by the object between t=0 and t=10 seconds.
Answer: From t=0 to t=4, the object travels 8 meters (from 0m to 8m). From t=4 to t=8, the object travels -4 meters (from 8m to 4m). From t=8 to t=10, the object travels 2 meters (from 4m to 6m). The total distance travelled is therefore |8| + |-4| + |2| = 8 + 4 + 2 = 14 meters.
If you are looking for Describing Positions (B) Worksheet | Key Stage 1 PDF Geometry you’ve visit to the right place. We have 20 Pictures about Describing Positions (B) Worksheet | Key Stage 1 PDF Geometry like Position Time Graph Worksheet New Quiz & Worksheet Position & Speed Vs, Worksheet On Distance Time Graph – Worksheets Library and also Position Vs Time Graph Worksheet With Answers – Printable Word Searches. Read more:
Describing Positions (B) Worksheet | Key Stage 1 PDF Geometry

worksheets.clipart-library.com
Velocity Vs Time Graph Worksheet Answers

worksheetpic101.s3.amazonaws.com
Worksheet On Distance Time Graph – Worksheets Library

worksheets.clipart-library.com
Position Time Graph Worksheet New Quiz & Worksheet Position & Speed Vs

chessmuseum.org
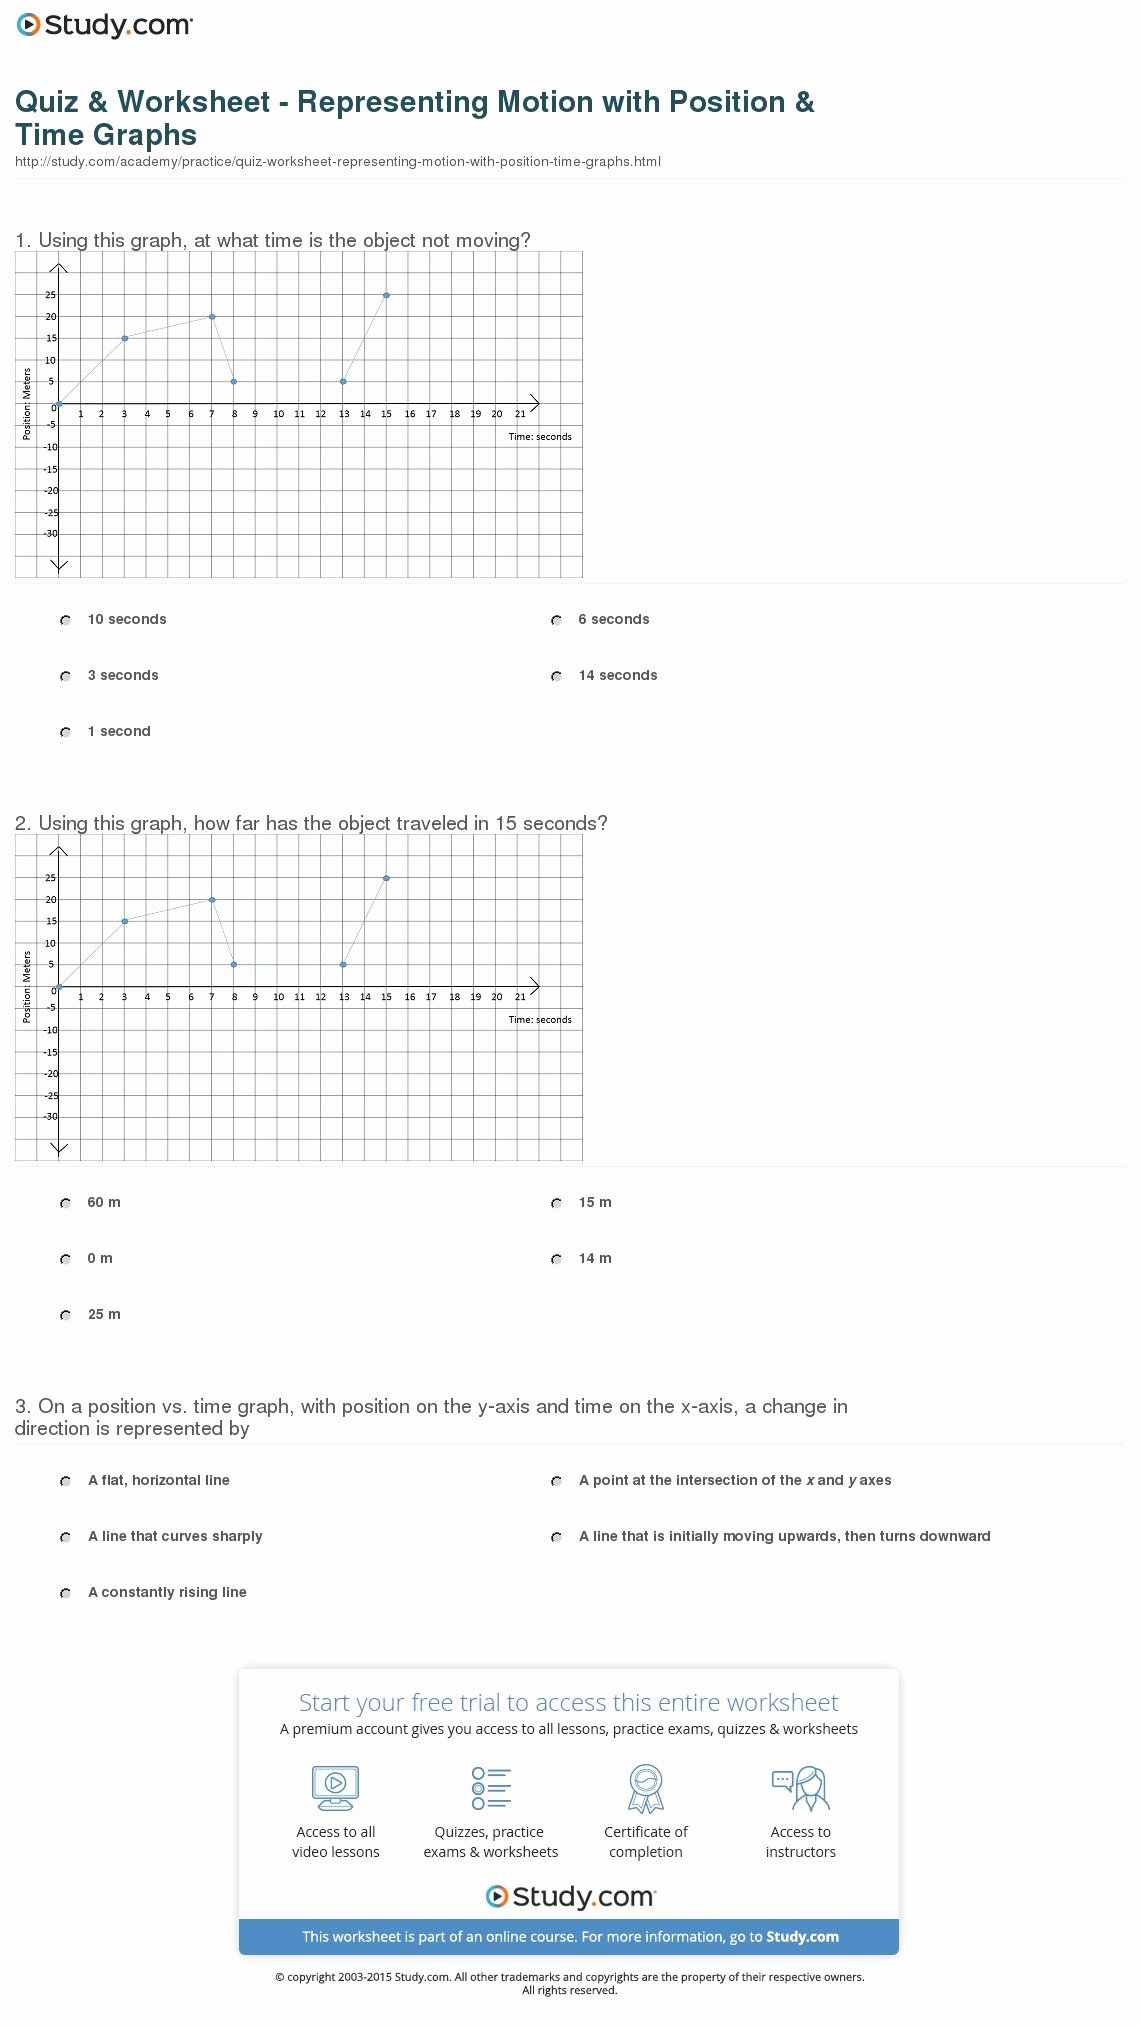
Position Time Graph Worksheet Lovely Position Time Graph Worksheet
chessmuseum.org
Position Vs Time Graph Worksheet With Answers – Printable Word Searches

davida.davivienda.com
This Worksheet Is About Position-time And Velocity-time Graphs

worksheets.clipart-library.com
Free Velocity Time Graph Worksheet Answers, Download Free Velocity Time

worksheets.clipart-library.com
Distance Time Graph Worksheet | Measurement And Data – Worksheets Library

worksheets.clipart-library.com
Speed Time Graph Worksheet – Worksheets Printable Free

wks.udlvirtual.edu.pe
Position Vs Time Graph Worksheet

sonoremoqdblearning.z14.web.core.windows.net
Position Vs Time Graph Worksheet – Printable Word Searches

davida.davivienda.com
Position Vs Time Graph Worksheet

brisaswowlessondb.z13.web.core.windows.net
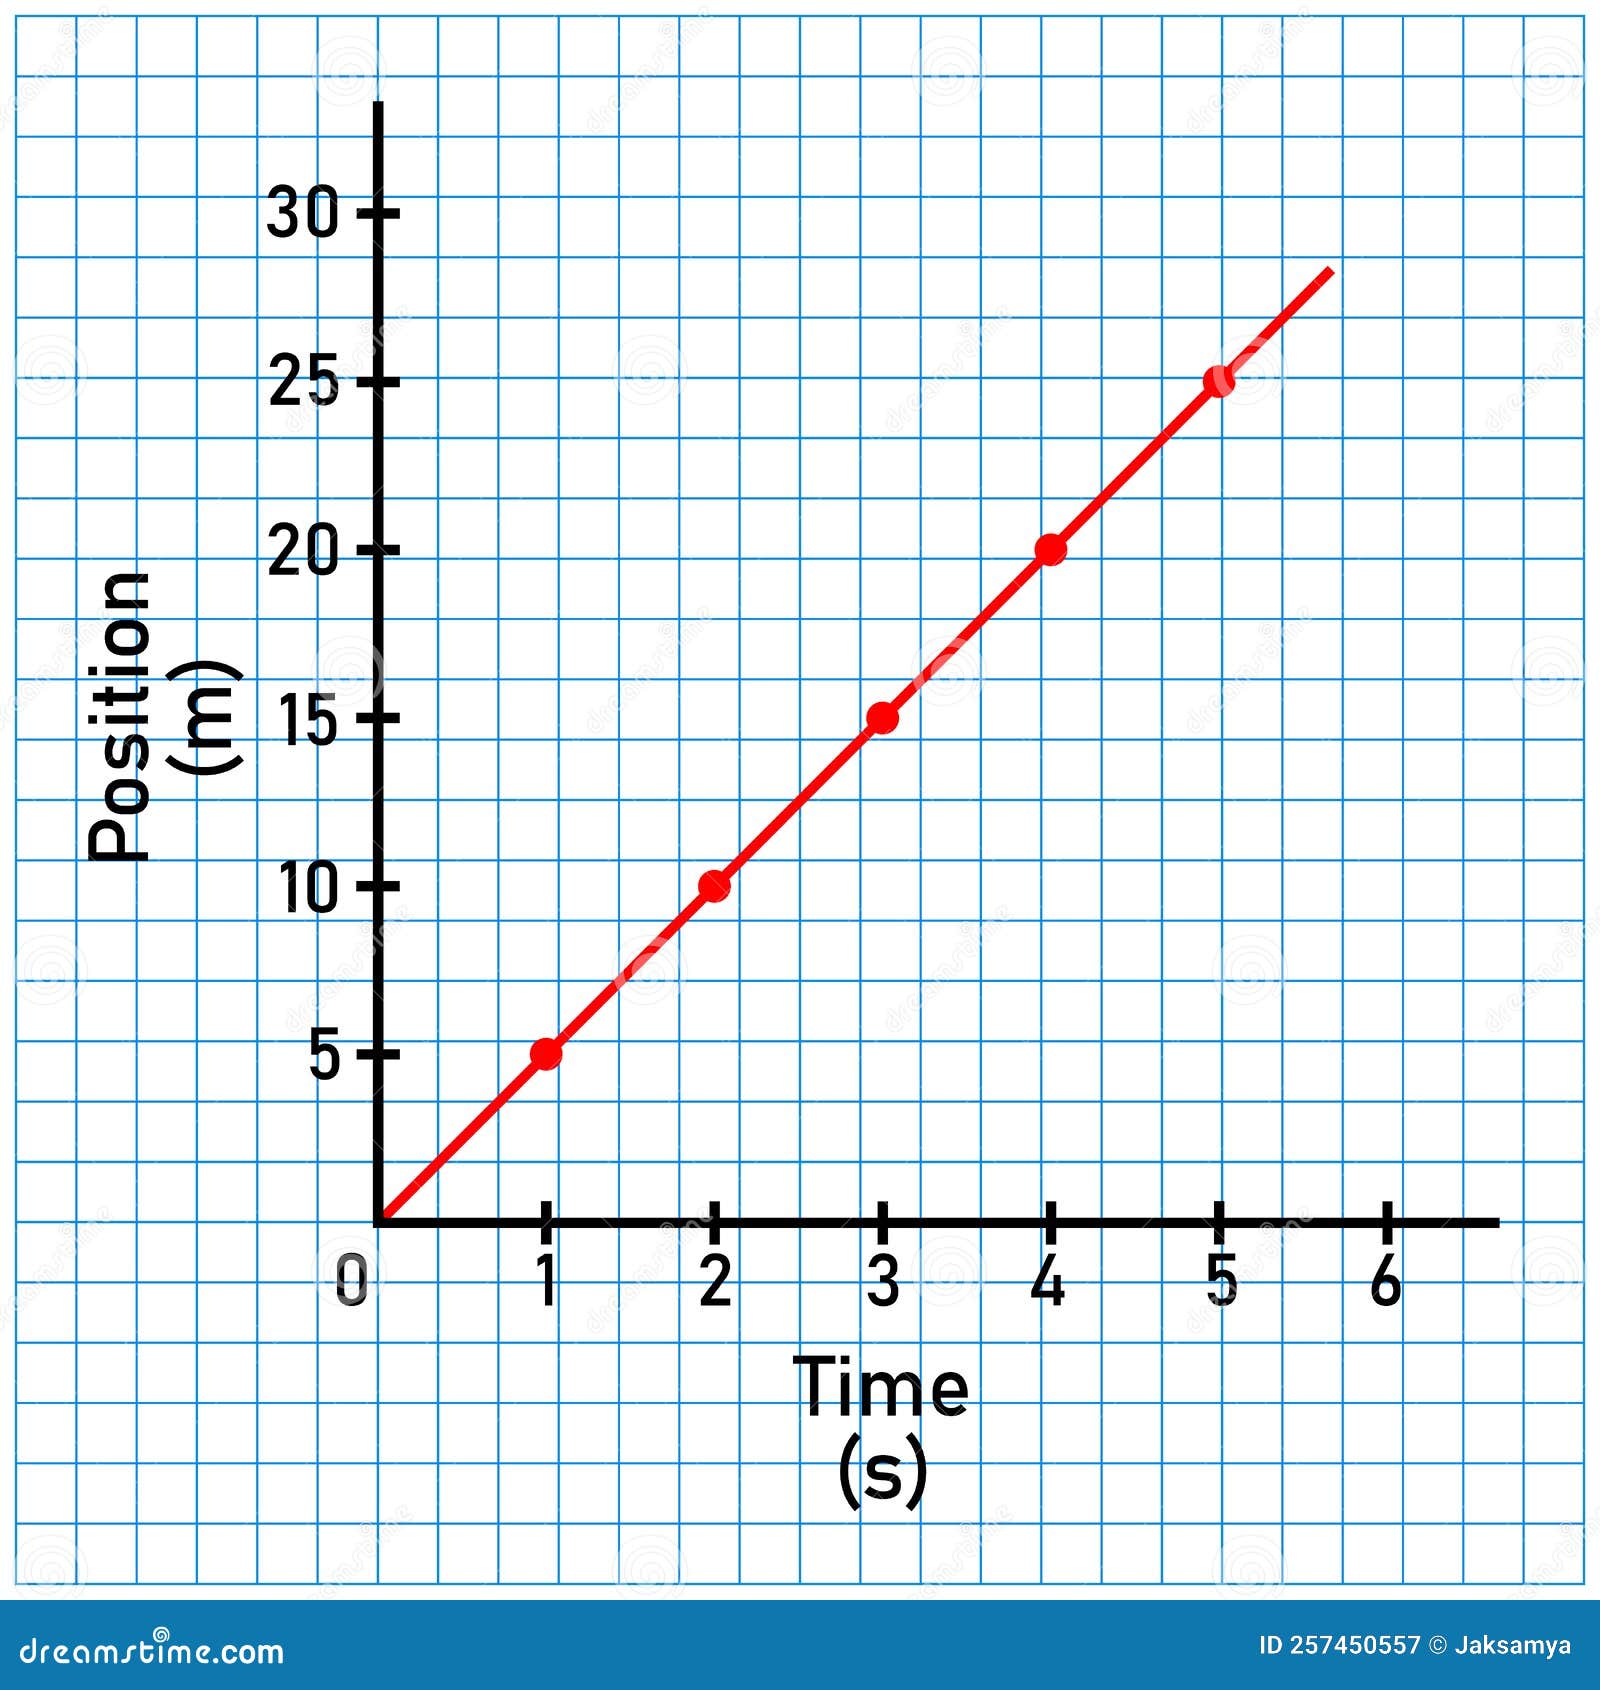
Position Time Graph For Uniform Motion. Stock Vector – Illustration Of
www.dreamstime.com
Position Time Graph Worksheet – E-streetlight.com

www.e-streetlight.com
Speed Time Graphs Worksheet | Fun And Engaging PDF Worksheets

worksheets.clipart-library.com
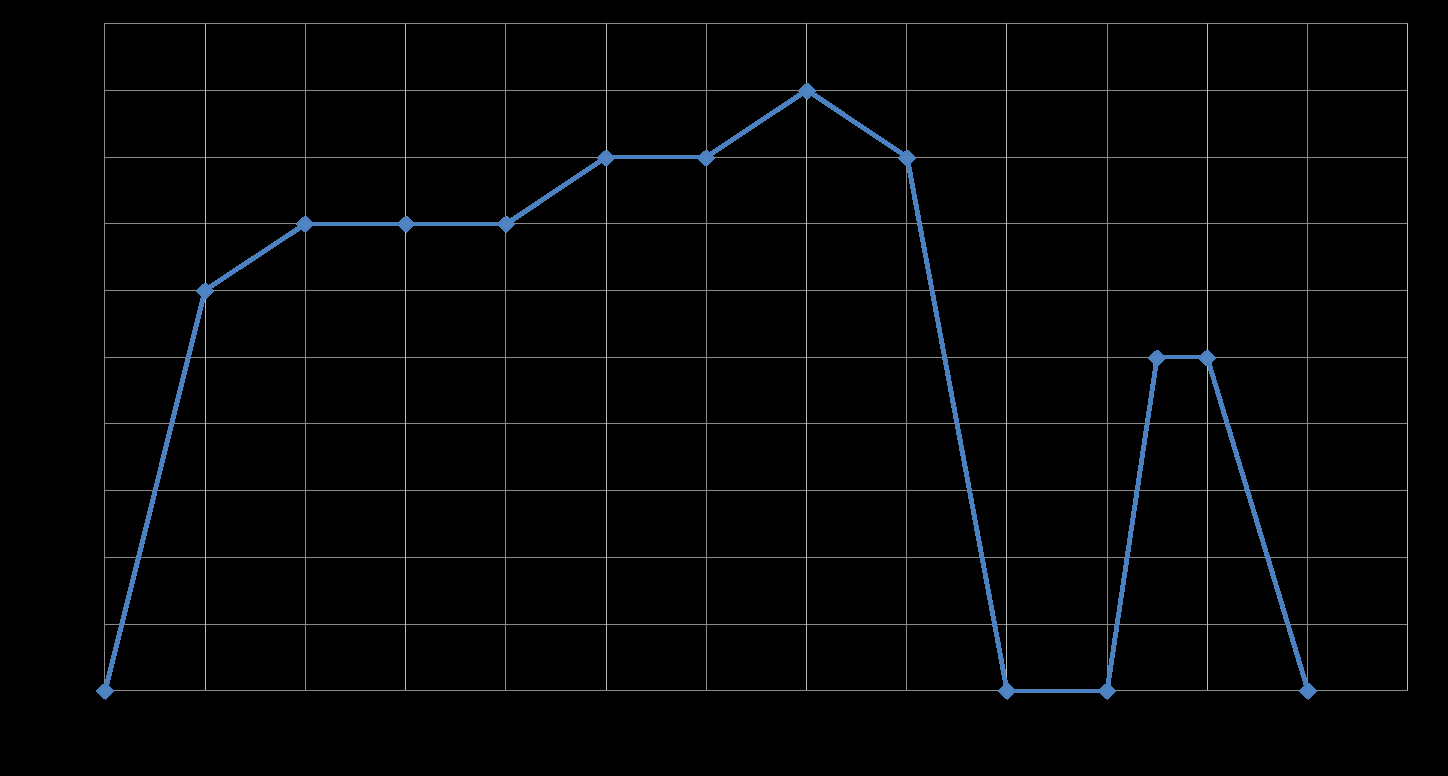
Position Time Graph Worksheet Elegant Position Time Graph Worksheet
chessmuseum.org
Time / FREE Printable Worksheets – Worksheetfun – Worksheets Library

worksheets.clipart-library.com
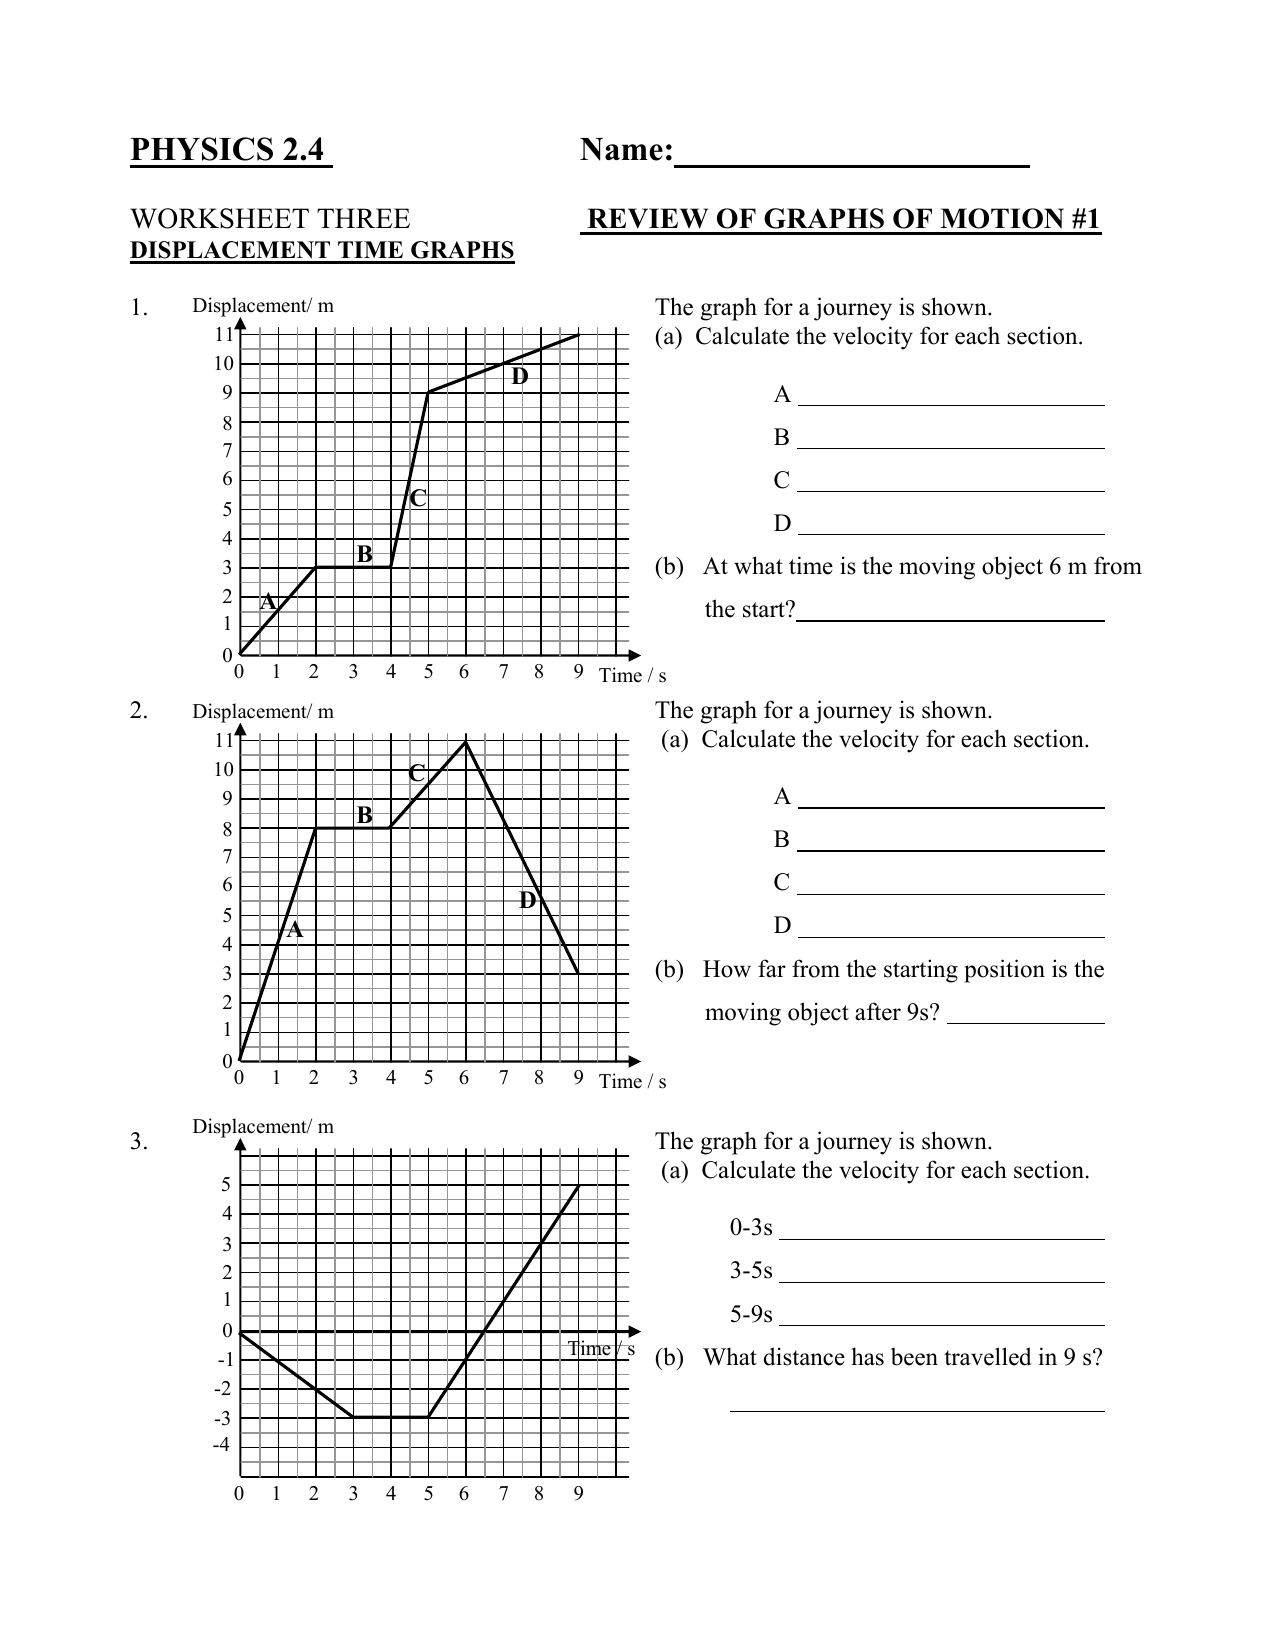
Position Time Graph Worksheet – Educational Worksheet
educational-worksheet.blogspot.com
Position-time Graph Worksheet

bauschule3n6dblearning.z14.web.core.windows.net
This worksheet is about position-time and velocity-time graphs. position vs time graph worksheet. time / free printable worksheets – worksheetfun