Understanding data is crucial in today’s world, and one of the most effective visual tools for summarizing and analyzing data is the box and whisker plot (also known as a boxplot). Boxplots provide a clear and concise way to represent the distribution of a dataset, highlighting key statistical measures such as the median, quartiles, and outliers. This makes them invaluable for comparing different datasets and identifying potential trends or anomalies.
Whether you’re a student learning about descriptive statistics, a teacher looking for engaging resources, or a data enthusiast wanting to sharpen your skills, mastering box and whisker plots is essential. That’s why we’ve prepared a comprehensive box and whisker plot worksheet designed to help you solidify your understanding and practice your skills. This worksheet covers various aspects of boxplot creation and interpretation, from identifying the five-number summary to analyzing the shape of the distribution.
This worksheet will challenge you to create boxplots from provided data, interpret existing boxplots, and answer questions about the data’s central tendency, spread, and potential outliers. Working through these exercises will not only reinforce your understanding of the underlying concepts but also build your confidence in applying these skills in real-world scenarios. Think of analyzing test scores, comparing sales figures, or even evaluating the effectiveness of different treatments – boxplots can provide valuable insights in all these areas.
Below you’ll find the answers to our box and whisker plot worksheet. Reviewing these answers alongside your completed work is a great way to identify areas where you excel and areas that may require further study. Remember, understanding the ‘why’ behind the ‘how’ is just as important as getting the right answers. So, take the time to analyze the explanations and think about the implications of the data presented.
Box and Whisker Plot Worksheet Answers
Here are the answers to the box and whisker plot worksheet. Please use these to check your work and understand any areas where you might have struggled.
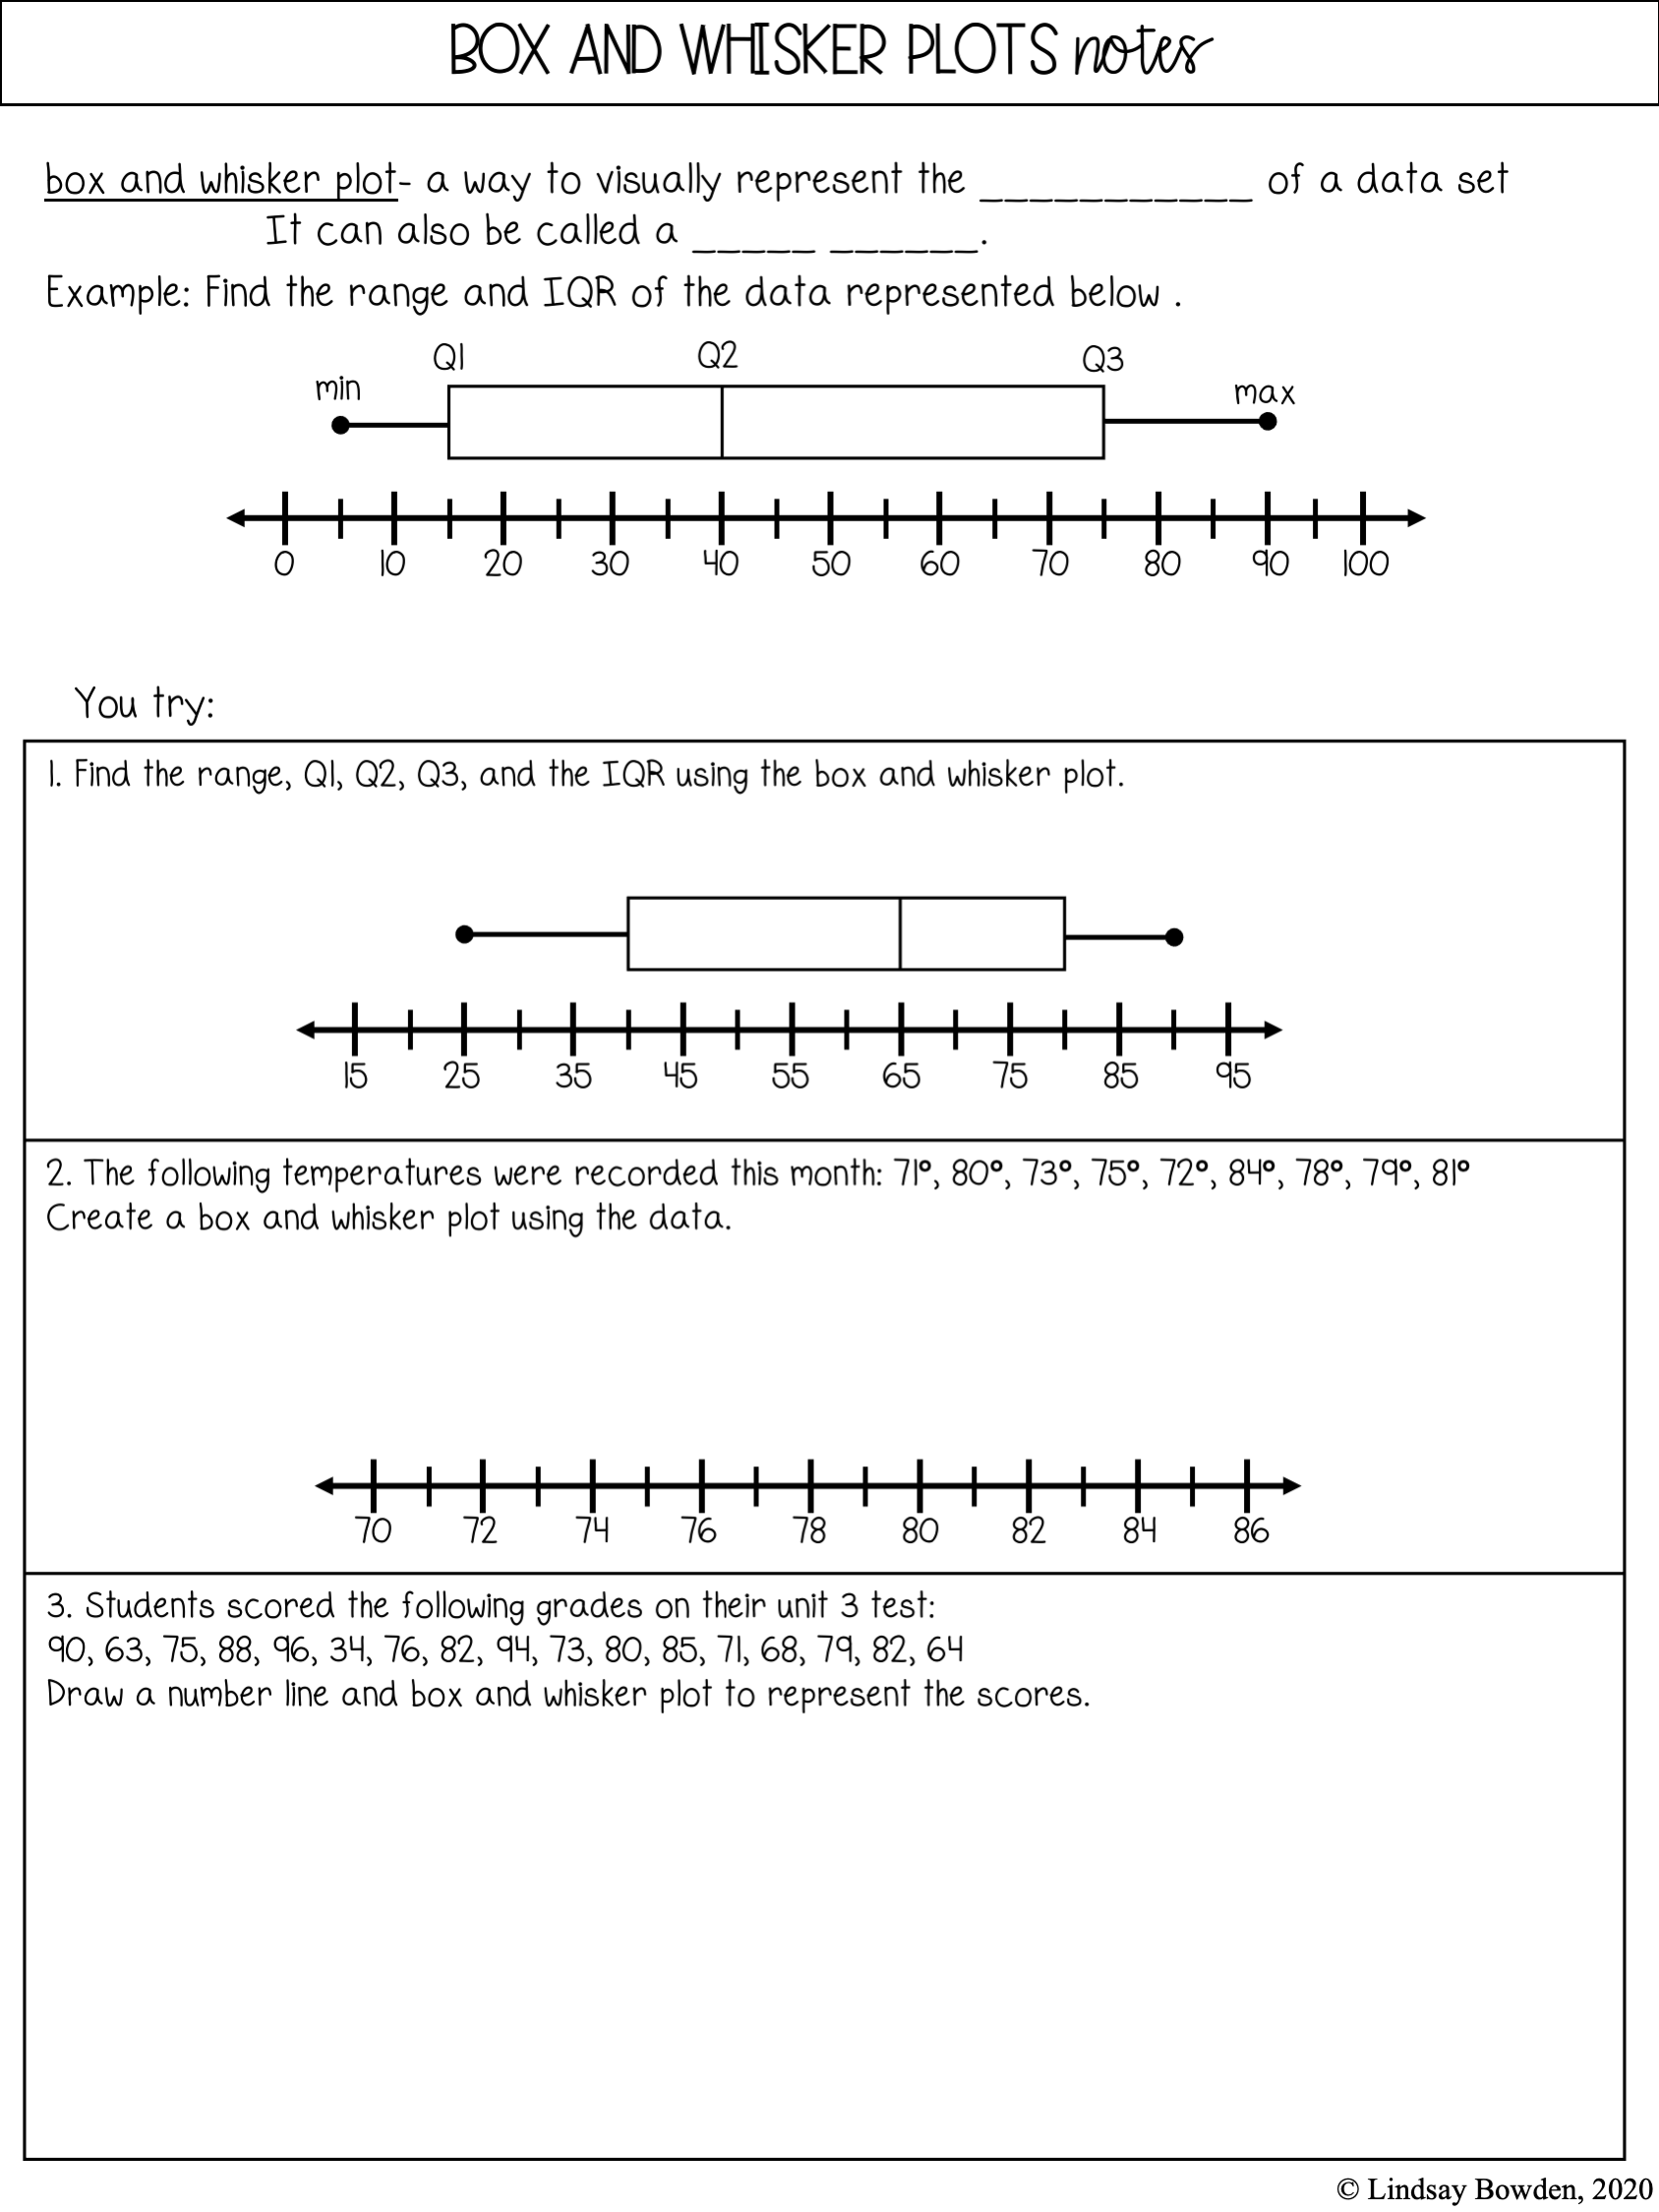
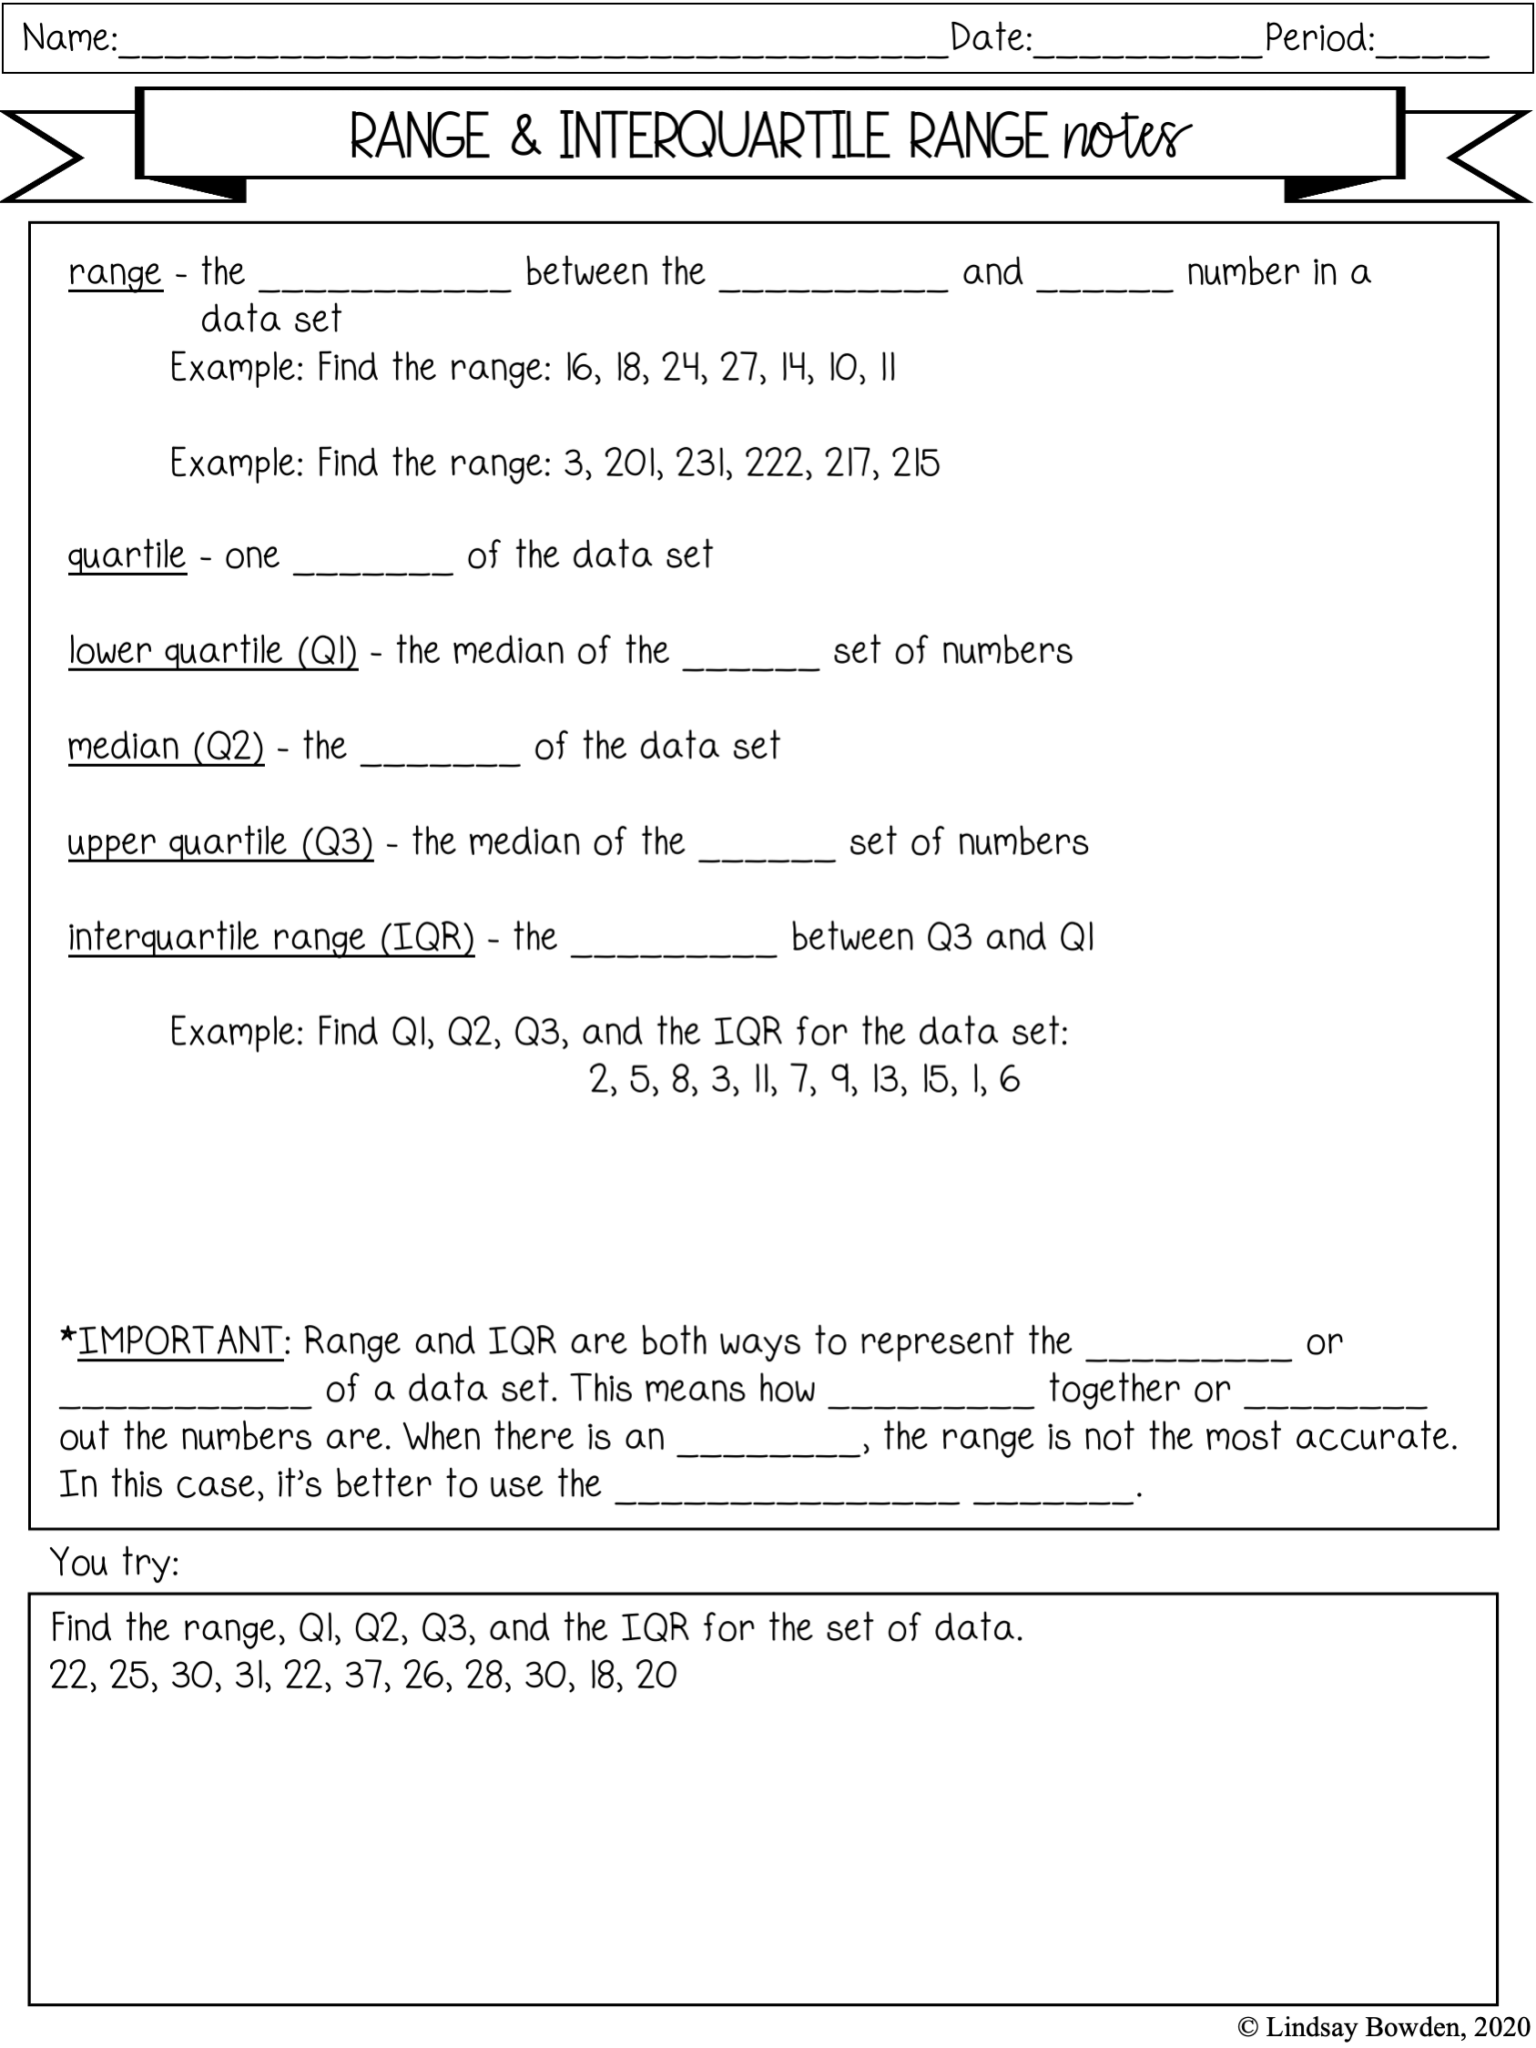
Understanding the Five-Number Summary
- Question 1: What is the minimum value in the following dataset: 5, 10, 15, 20, 25, 30, 35?
- Answer: 5
- Question 2: What is the maximum value in the following dataset: 5, 10, 15, 20, 25, 30, 35?
- Answer: 35
- Question 3: What is the median of the following dataset: 5, 10, 15, 20, 25, 30, 35?
- Answer: 20
- Question 4: What is the first quartile (Q1) of the following dataset: 5, 10, 15, 20, 25, 30, 35?
- Answer: 10
- Question 5: What is the third quartile (Q3) of the following dataset: 5, 10, 15, 20, 25, 30, 35?
- Answer: 30
Creating Box and Whisker Plots
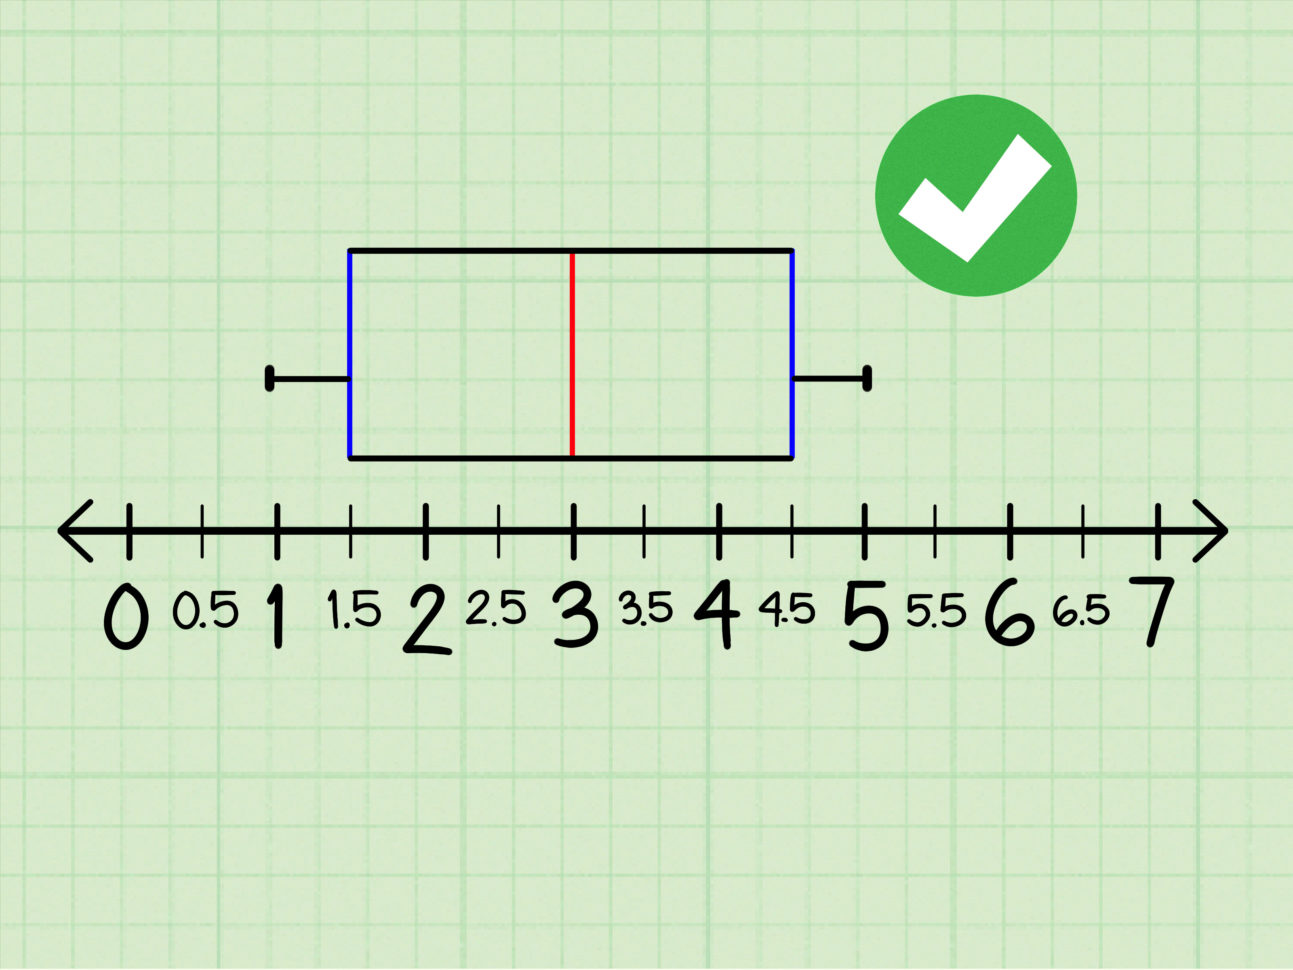
- Question 6: Create a box and whisker plot for the following dataset: 12, 15, 18, 20, 22, 25, 28.
- Answer: (This answer requires a visual representation. Describe the boxplot.) Minimum: 12, Q1: 15, Median: 20, Q3: 25, Maximum: 28. The box extends from 15 to 25, with a line at 20. Whiskers extend to 12 and 28.
- Question 7: Create a box and whisker plot for the following dataset: 3, 7, 9, 11, 15, 18, 21.
- Answer: (This answer requires a visual representation. Describe the boxplot.) Minimum: 3, Q1: 7, Median: 11, Q3: 18, Maximum: 21. The box extends from 7 to 18, with a line at 11. Whiskers extend to 3 and 21.
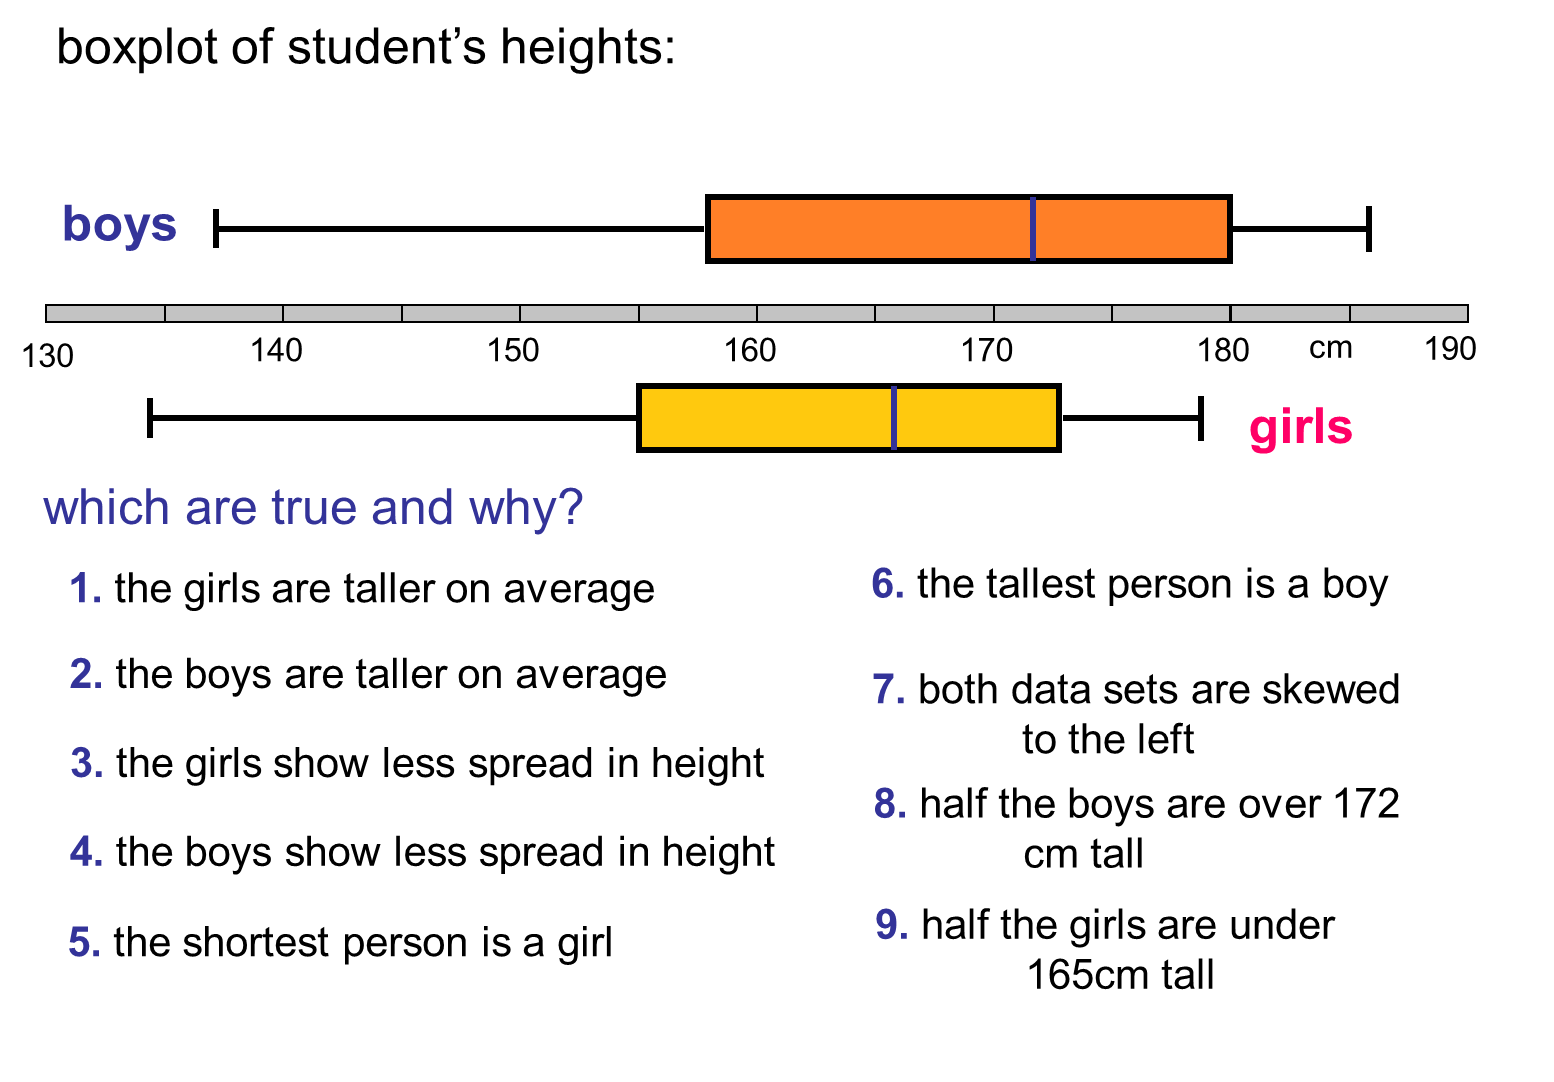
Interpreting Box and Whisker Plots
- Question 8: A boxplot shows a box extending from 10 to 25, with a median at 18. The whiskers extend to 5 and 30. What is the interquartile range (IQR)?
- Answer: 15 (25 – 10)
- Question 9: In the same boxplot from Question 8, are there any potential outliers?
- Answer: Potentially. We need to calculate the outlier fences. Lower fence: Q1 – 1.5 * IQR = 10 – 1.5 * 15 = -12.5. Upper fence: Q3 + 1.5 * IQR = 25 + 1.5 * 15 = 47.5. Since the minimum is 5 and the maximum is 30, there are no outliers based on this boxplot alone. If we had data points outside these fences they would be outliers.
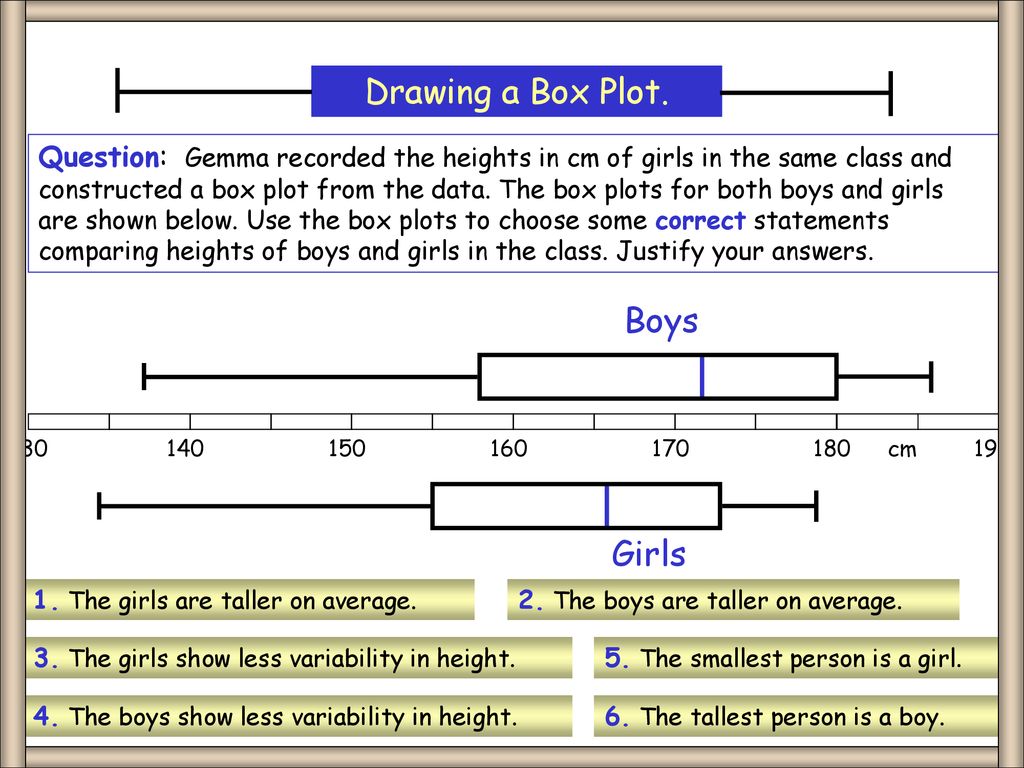
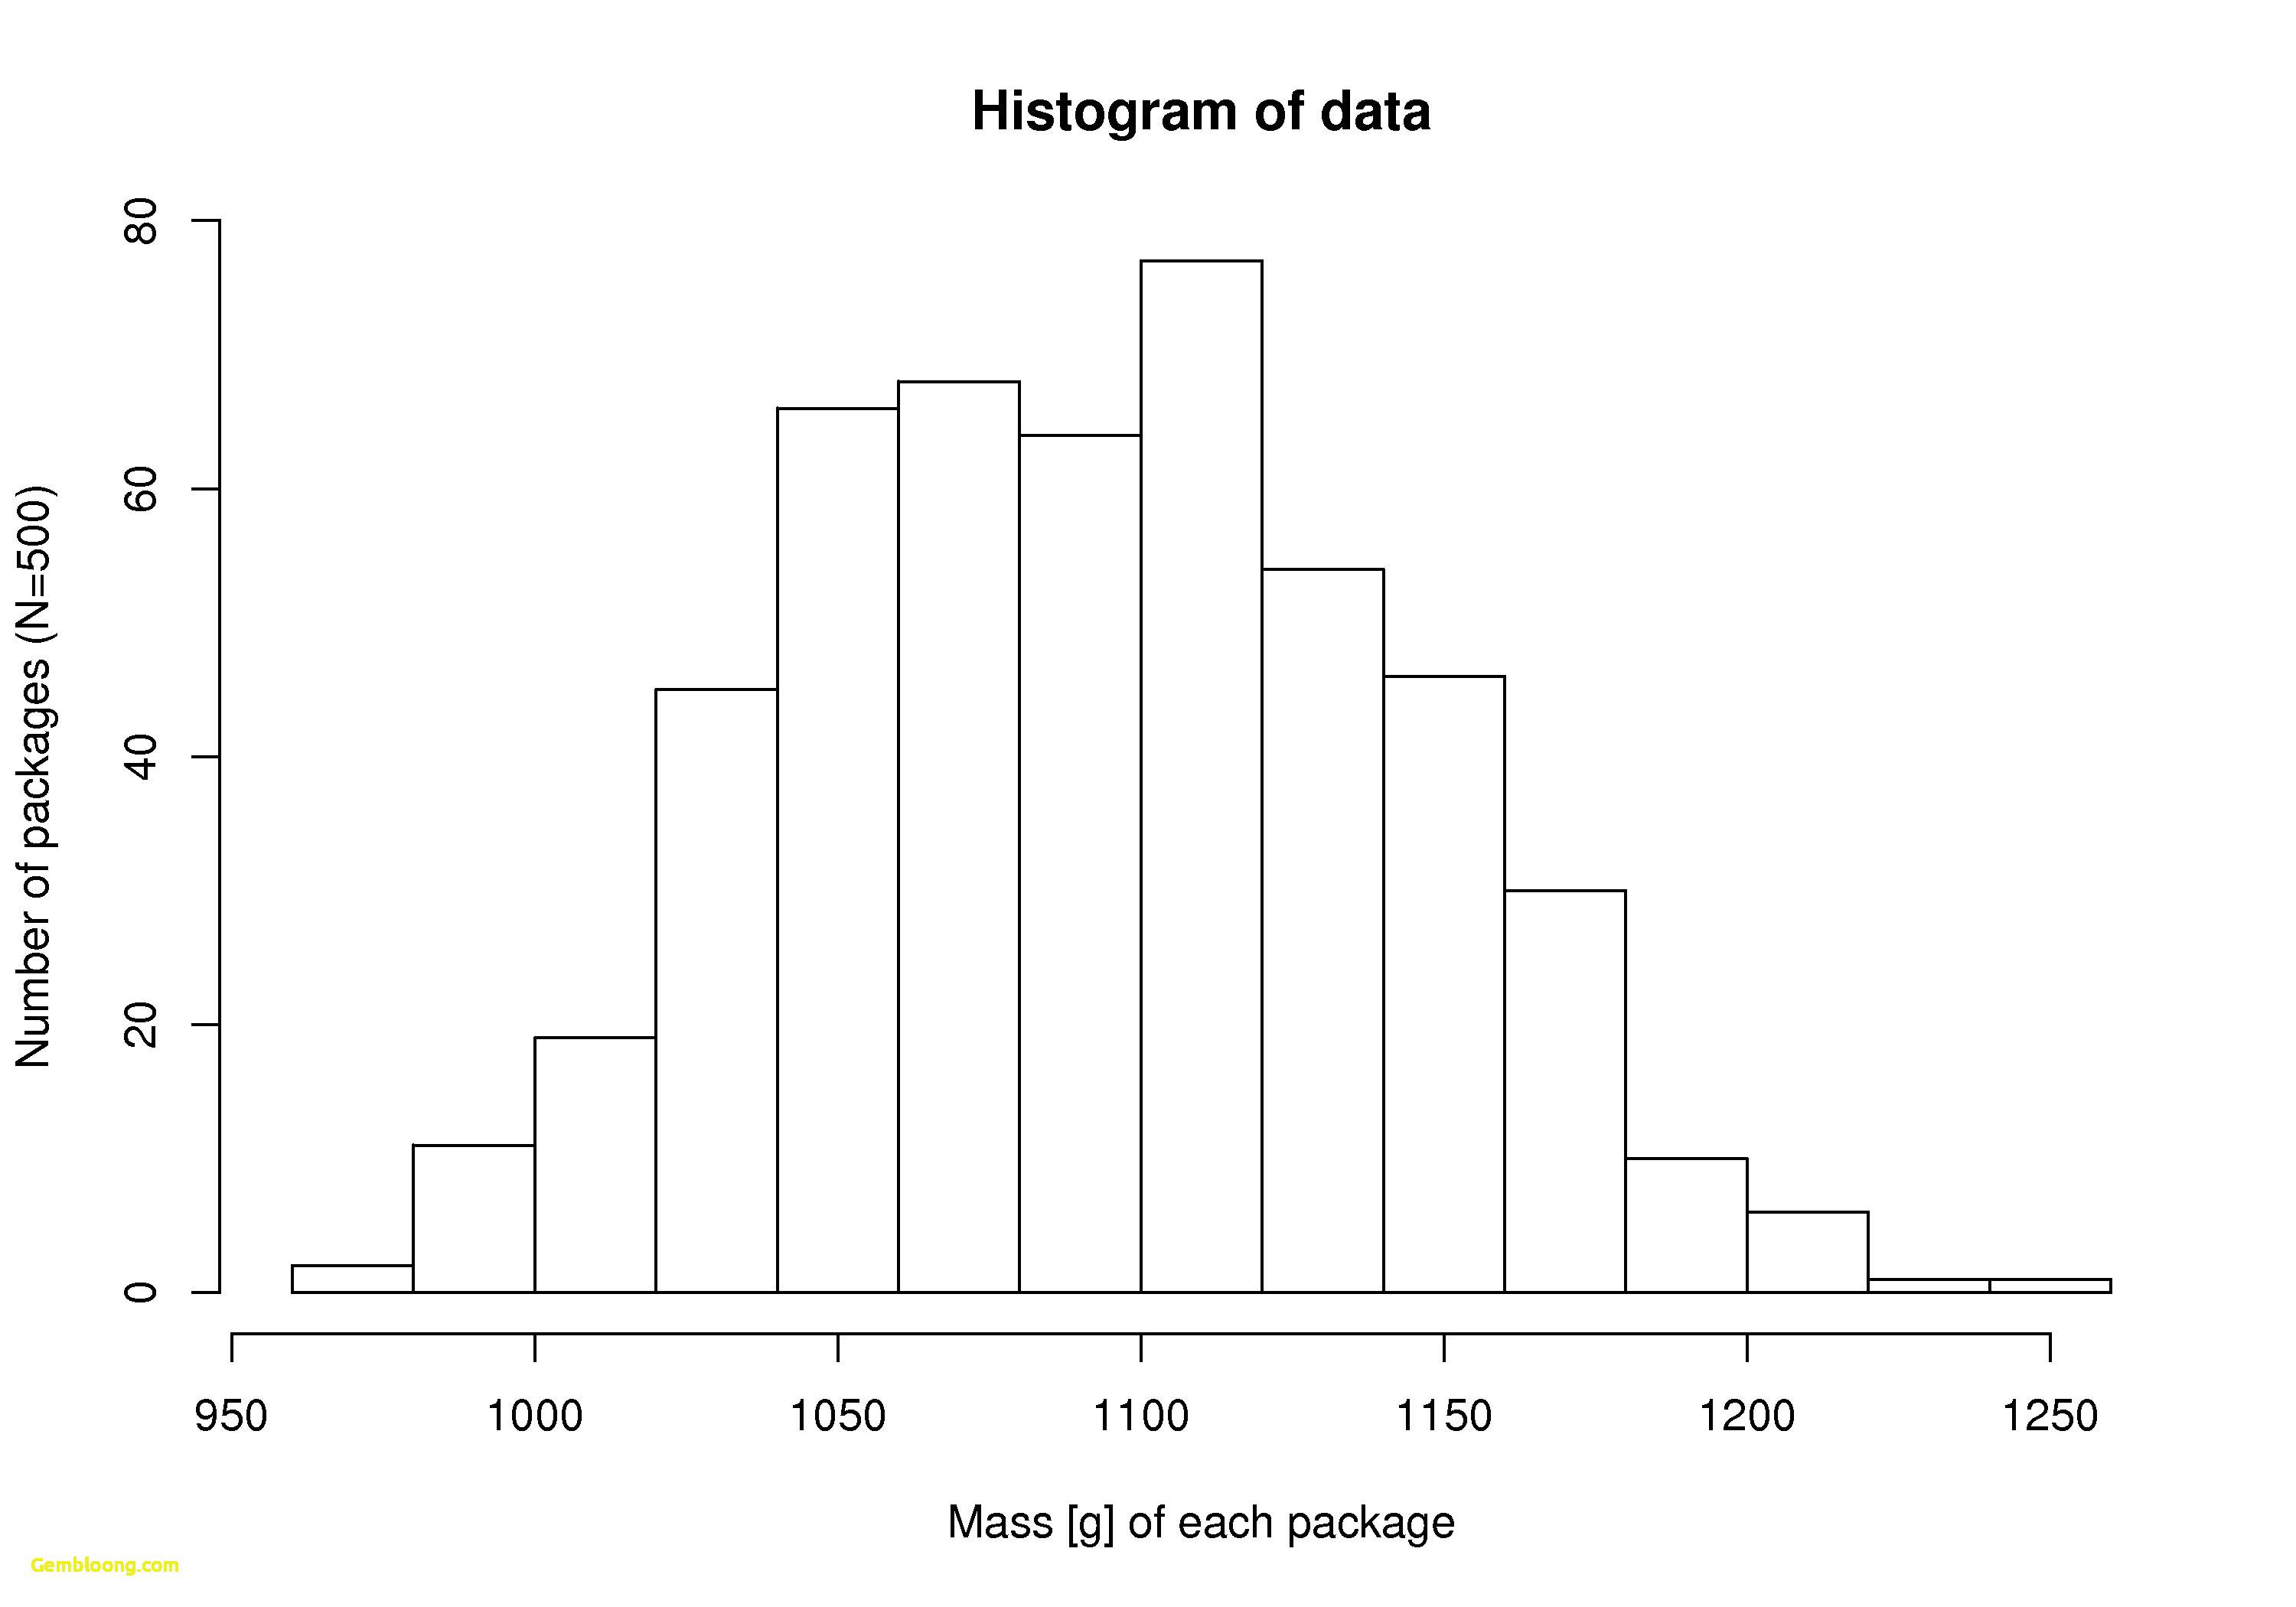
- Question 10: A boxplot shows a long whisker on the right side and a short whisker on the left side. What does this indicate about the distribution of the data?
- Answer: The data is likely skewed to the right (positively skewed). This means the data has a tail extending towards higher values.
We hope this worksheet and answer key have been helpful in your learning journey. Remember, practice is key to mastering any skill. Keep practicing, keep exploring, and keep analyzing data with the powerful tool of box and whisker plots!
If you are looking for Box and whisker plot worksheet 2 answer key – geracoop you’ve visit to the right page. We have 20 Pictures about Box and whisker plot worksheet 2 answer key – geracoop like Box and Whisker Plots – Digital and Printable – Worksheets Library, Box and Whisker Plot Worksheets – Worksheets Library and also Box And Whisker Plot Worksheet. Here you go:
Box And Whisker Plot Worksheet 2 Answer Key – Geracoop
geracoop.weebly.com
The Double Box And Whisker Plot Shows The Ages Of The Viewers Of

worksheets.clipart-library.com
Box Whisker Plot Worksheet | Farm1.fieldagent.net

farm1.fieldagent.net
️Box And Whisker Plot Worksheet Free Download| Goodimg.co

goodimg.co
Box And Whisker Plot Worksheet Box And Whisker Plot Practice Worksheet

www.pinterest.com
The Double Box And Whisker Plot Shows The Test Scores For Two

worksheets.clipart-library.com
Box And Whisker Plot Practice Worksheet – Printable PDF Template

martinlindelof.com
The Double Box And Whisker Plot Shows The Ages Of The Viewers Of
worksheets.clipart-library.com
Box And Whisker Plot Worksheets – Worksheets Library
worksheets.clipart-library.com
Box And Whisker Plot Worksheet With Answers – Printable PDF Template

martinlindelof.com
Box And Whisker Plots Notes And Worksheets – Lindsay Bowden | Secondary

www.pinterest.com
Box And Whisker Plot Worksheet
www.proworksheet.my.id
Box And Whisker Plot Worksheet
www.proworksheet.my.id
Box And Whisker Plot Worksheet
www.proworksheet.my.id
Double Box-and-Whisker Plots | CK-12 Foundation – Worksheets Library

worksheets.clipart-library.com
Box And Whisker Plot Worksheet – E-streetlight.com
www.e-streetlight.com
The Double Box And Whisker Plot Represents The Points Scored Per

worksheets.clipart-library.com
Box And Whisker Plots – Digital And Printable – Worksheets Library

worksheets.clipart-library.com
Double Box-and-Whisker Plots | CK-12 Foundation – Worksheets Library
worksheets.clipart-library.com
Box And Whisker Plot Worksheet
www.proworksheet.my.id
box and whisker plot worksheet – e-streetlight.com. The double box and whisker plot represents the points scored per …. ️box and whisker plot worksheet free download| goodimg.co