Motion graphs are fundamental tools in physics, allowing us to visualize and understand the motion of objects over time. They provide a visual representation of position, velocity, and acceleration, enabling us to analyze and predict how objects will move. A well-designed Motion Graphs Physics Worksheet can be an invaluable resource for students learning about kinematics and dynamics. It provides structured practice in interpreting and creating these graphs, solidifying their understanding of the relationships between displacement, velocity, acceleration, and time.
These worksheets typically present scenarios involving moving objects, such as cars, balls, or even people. Students are then tasked with constructing position-time, velocity-time, and acceleration-time graphs to represent the motion. Conversely, they might be given a graph and asked to describe the motion it represents, calculate quantities like displacement and acceleration, or predict future positions.
The key to mastering motion graphs lies in understanding the following principles:
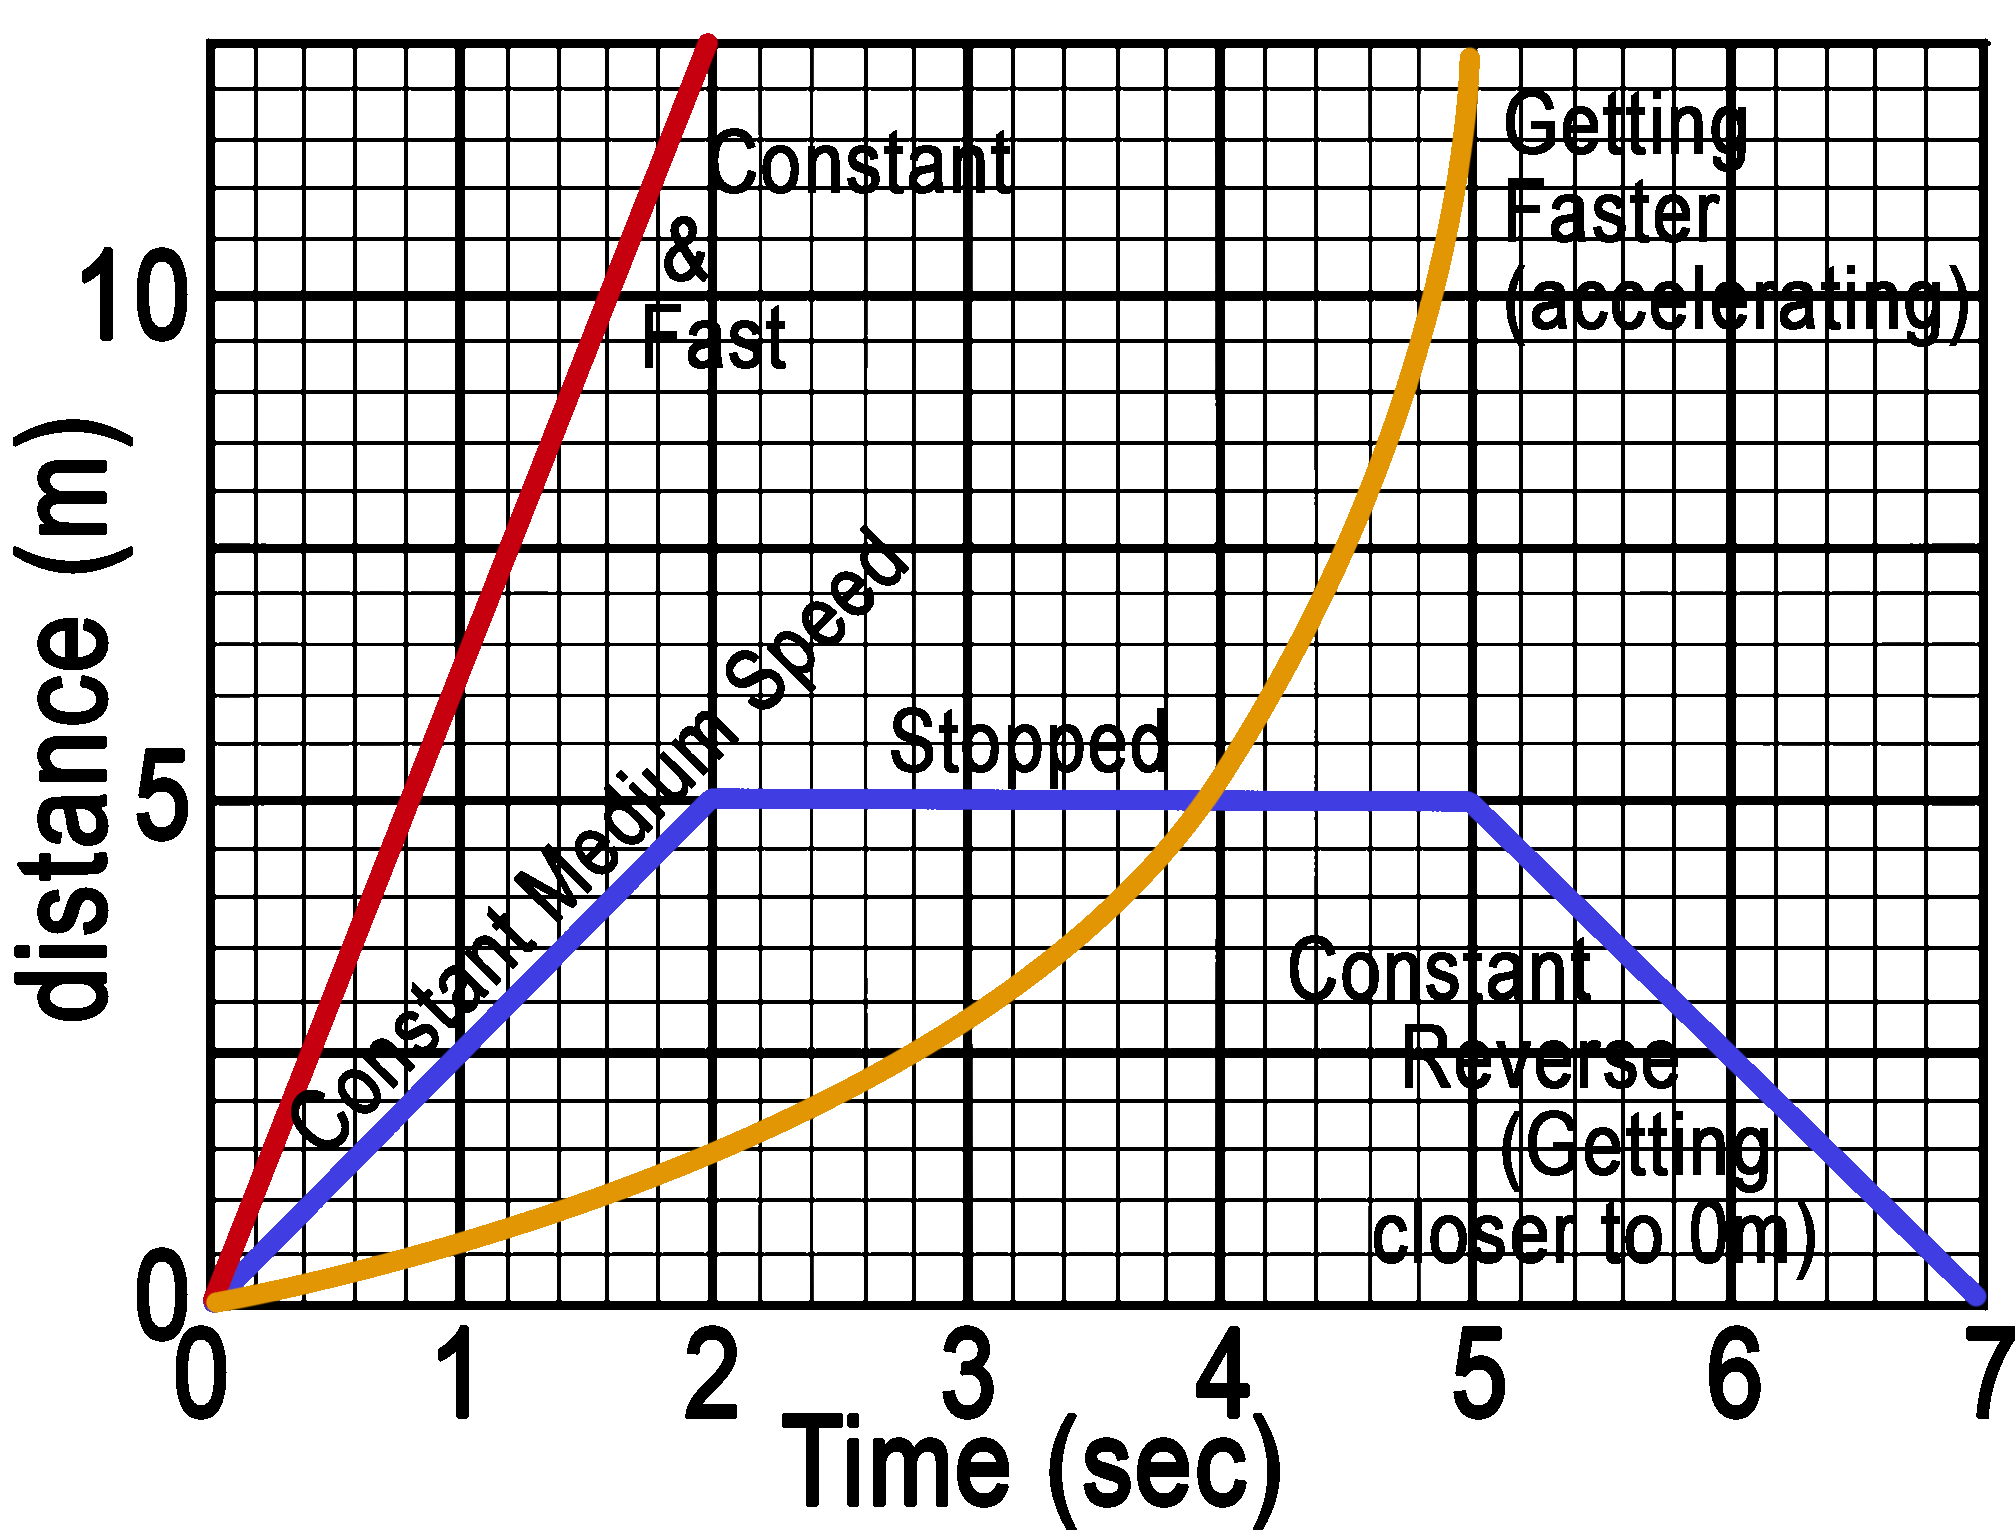
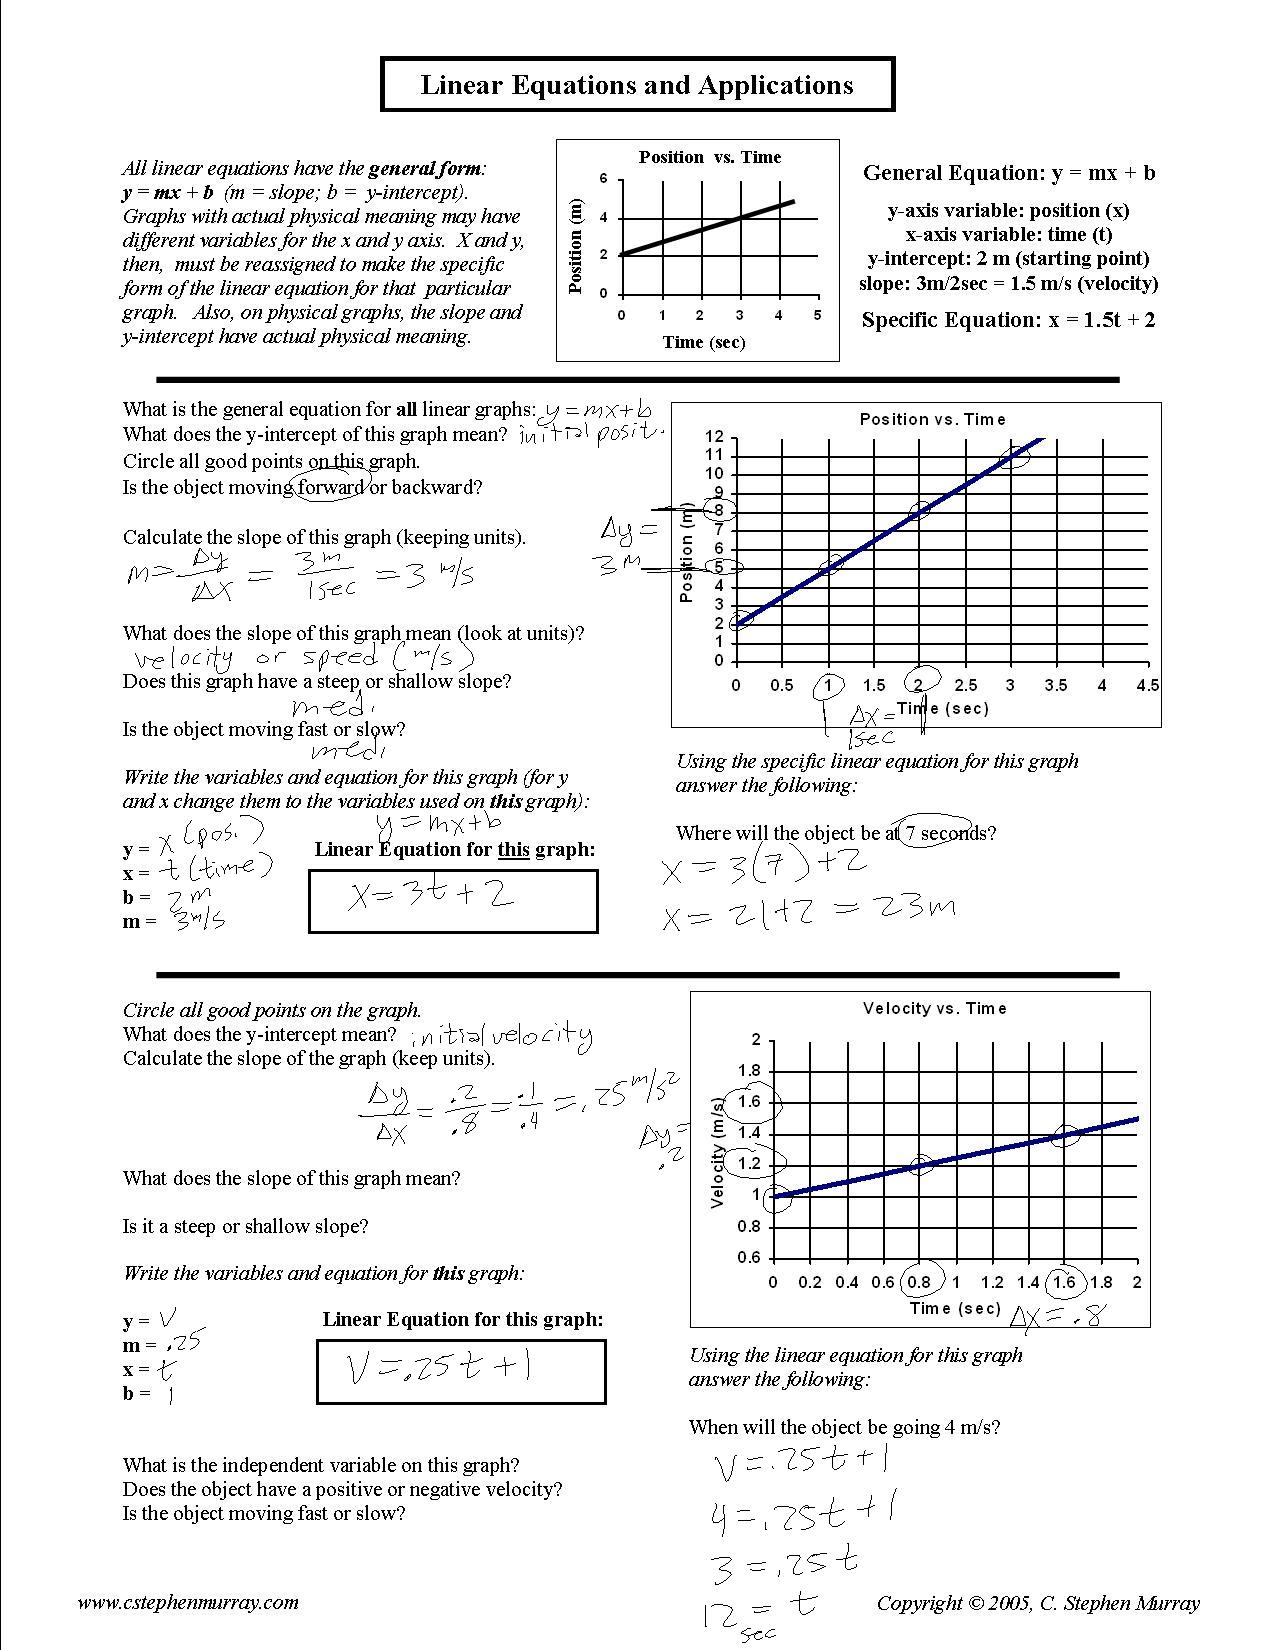
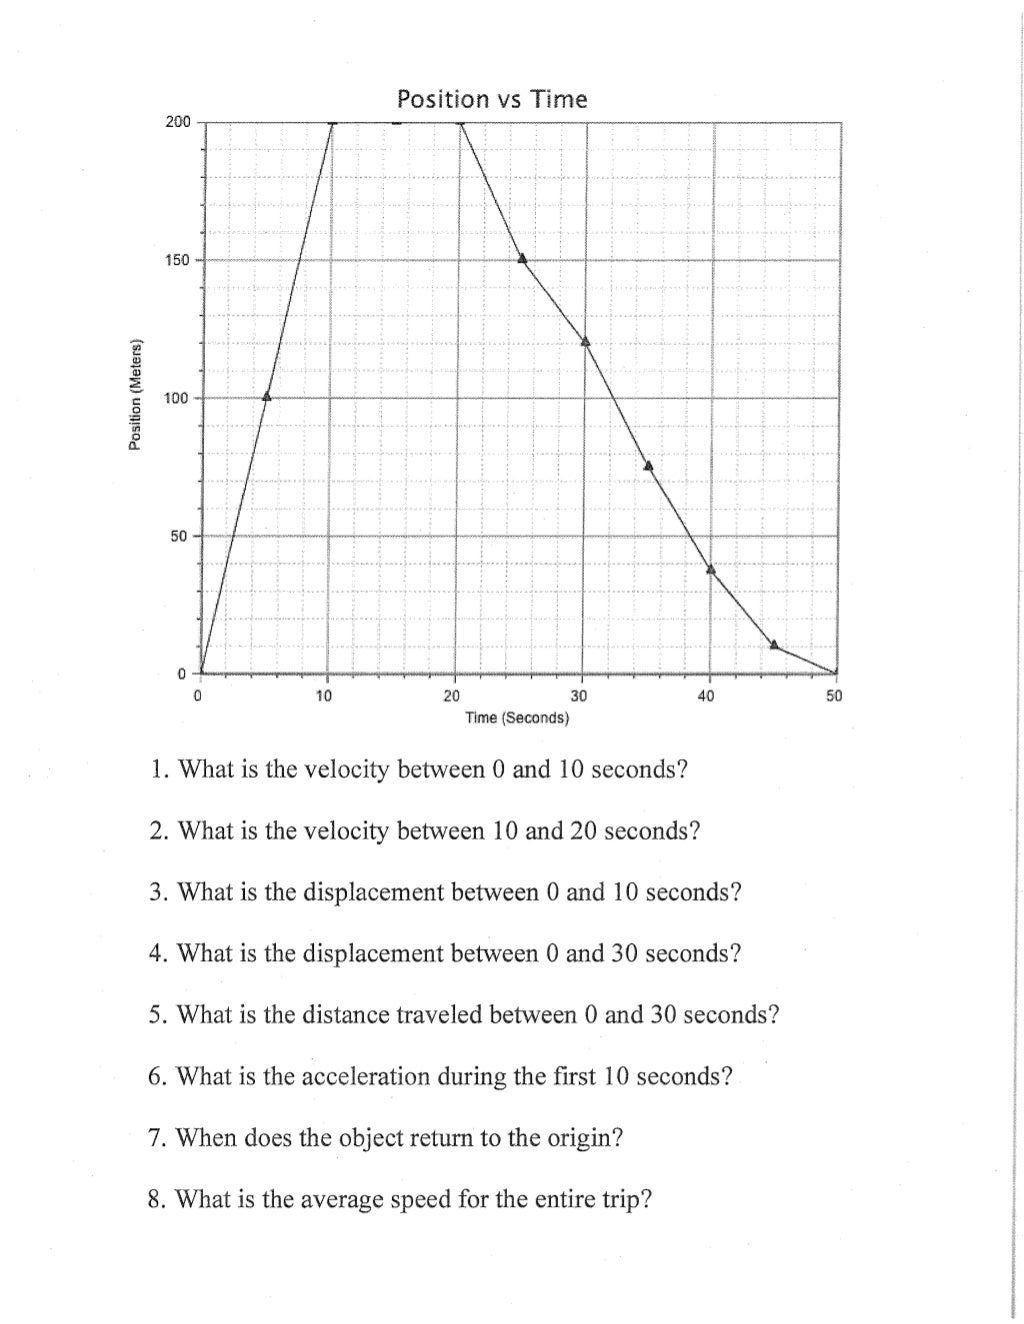
* **Position-Time Graphs (x-t):** The slope of a position-time graph represents the velocity of the object. A constant slope indicates constant velocity, while a changing slope indicates acceleration. A horizontal line means the object is stationary. The y-intercept indicates the object’s initial position.
* **Velocity-Time Graphs (v-t):** The slope of a velocity-time graph represents the acceleration of the object. A constant slope indicates constant acceleration, while a changing slope indicates a changing acceleration (which is beyond the scope of introductory physics). A horizontal line means the object is moving at a constant velocity. The area under the curve represents the displacement of the object. A velocity below the time axis indicates motion in the negative direction.
* **Acceleration-Time Graphs (a-t):** The area under an acceleration-time graph represents the change in velocity. A horizontal line indicates constant acceleration.
Using Motion Graphs Physics Worksheets helps students develop crucial skills such as:
* **Interpreting data:** Translating visual information from a graph into meaningful descriptions of motion.
* **Applying formulas:** Using the slopes and areas of graphs to calculate velocity, acceleration, and displacement.
* **Problem-solving:** Analyzing complex motion scenarios by breaking them down into simpler segments.
* **Critical thinking:** Connecting abstract concepts of kinematics to real-world situations.
By practicing with these worksheets, students build a strong foundation in kinematics, which is essential for understanding more advanced topics in physics like dynamics, energy, and momentum. Therefore, dedicating time and effort to mastering motion graphs is a worthwhile investment for any aspiring scientist or engineer.
Motion Graphs Physics Worksheet Answers
Sample Problems & Solutions
Below are sample problems you might find in a Motion Graphs Physics Worksheet, along with their solutions presented in an HTML list format. Keep in mind that actual worksheets will vary in content and difficulty.
- Problem 1: A car starts from rest and accelerates uniformly to 20 m/s in 5 seconds. It then maintains this velocity for 10 seconds before decelerating uniformly to rest in 4 seconds. Draw the velocity-time graph and calculate the total distance traveled.
- Solution: (The explanation is implied, the HTML list shows only results. In a real worksheet, you would show your work.)
- The velocity-time graph will consist of three line segments: increasing slope (0-5s), horizontal line (5-15s), and decreasing slope (15-19s).
- Distance during acceleration: Area of triangle = 0.5 * 5s * 20 m/s = 50 m
- Distance during constant velocity: Area of rectangle = 10s * 20 m/s = 200 m
- Distance during deceleration: Area of triangle = 0.5 * 4s * 20 m/s = 40 m
- Total Distance = 50m + 200m + 40m = 290 m
- Solution:(Assume the position at 5 seconds is 10 meters.)
- Average velocity (0-5s): Slope of the line = (10 m – 0 m) / (5 s – 0 s) = 2 m/s
- Velocity (5-8s): Slope of the horizontal line = 0 m/s (The runner is stationary.)
- Total displacement: The runner returns to the origin, so the total displacement is 0 m.
- Solution:
- Velocity at t=6 seconds: Change in velocity = Area under the graph = 2 m/s2 * 6 s = 12 m/s. Since the object started from rest, its velocity is 12 m/s.
- Velocity at t=10 seconds: The acceleration is zero from t=6s to t=10s, so the velocity remains constant at 12 m/s.
- Solution:
- The graph will start with a positive initial velocity (representing the upward launch).
- The slope of the line will be negative and constant (representing the constant downward acceleration due to gravity).
- The line will cross the x-axis (representing the point where the object momentarily stops at its highest point).
- The line will continue with a negative velocity (representing the object falling back down). The final velocity should be negative of initial velocity considering similar height.
If you are looking for Motion Graphs | A Level Physics Online you’ve came to the right page. We have 20 Pics about Motion Graphs | A Level Physics Online like Motion Graphs Physics Worksheet, Position and Motion Worksheet: Free Printable PDF for Kids – Worksheets and also Motion graphs worksheet|KS4 Physics|Teachit – Worksheets Library. Here it is:
Motion Graphs | A Level Physics Online

www.alevelphysicsonline.com
Position Time Graph Worksheet With Answers

worksheetpic101.s3.amazonaws.com
Motion Graph Analysis Worksheet Eighth Grade, Seventh Grade, Science

www.pinterest.es
Motion Graphs Physics Worksheet

www.proworksheet.my.id
Motion Graphs Physics Worksheet – Ame.my.id
ame.my.id
Motion Graphs Worksheet Answers – E-streetlight.com
www.e-streetlight.com
Motion Graphs Worksheet|KS4 Physics|Teachit – Worksheets Library

worksheets.clipart-library.com
Position And Motion Worksheet: Free Printable PDF For Kids – Worksheets

worksheets.clipart-library.com
SOLUTION: Physics Worksheet With Solutions – Studypool – Worksheets Library

worksheets.clipart-library.com
Motion Graphs – By Examining The Slope Of The Graphs, We Can Obtain

www.studocu.com
Worksheet Motion Graphs
lessonschoolstupent.z21.web.core.windows.net
Motion Graph Analysis Worksheet Inspirational Motion Graphs Practice

www.pinterest.com
3-10a – Motion Graphs Wkst-key – Worksheet: Motion Graphs

worksheets.clipart-library.com
Motion Graphs And Kinematics Worksheet

learningschoolgraciauwb.z4.web.core.windows.net
Worksheet 6 12 Motion Graphs – Motion Graphs Interactivity This
www.studocu.com
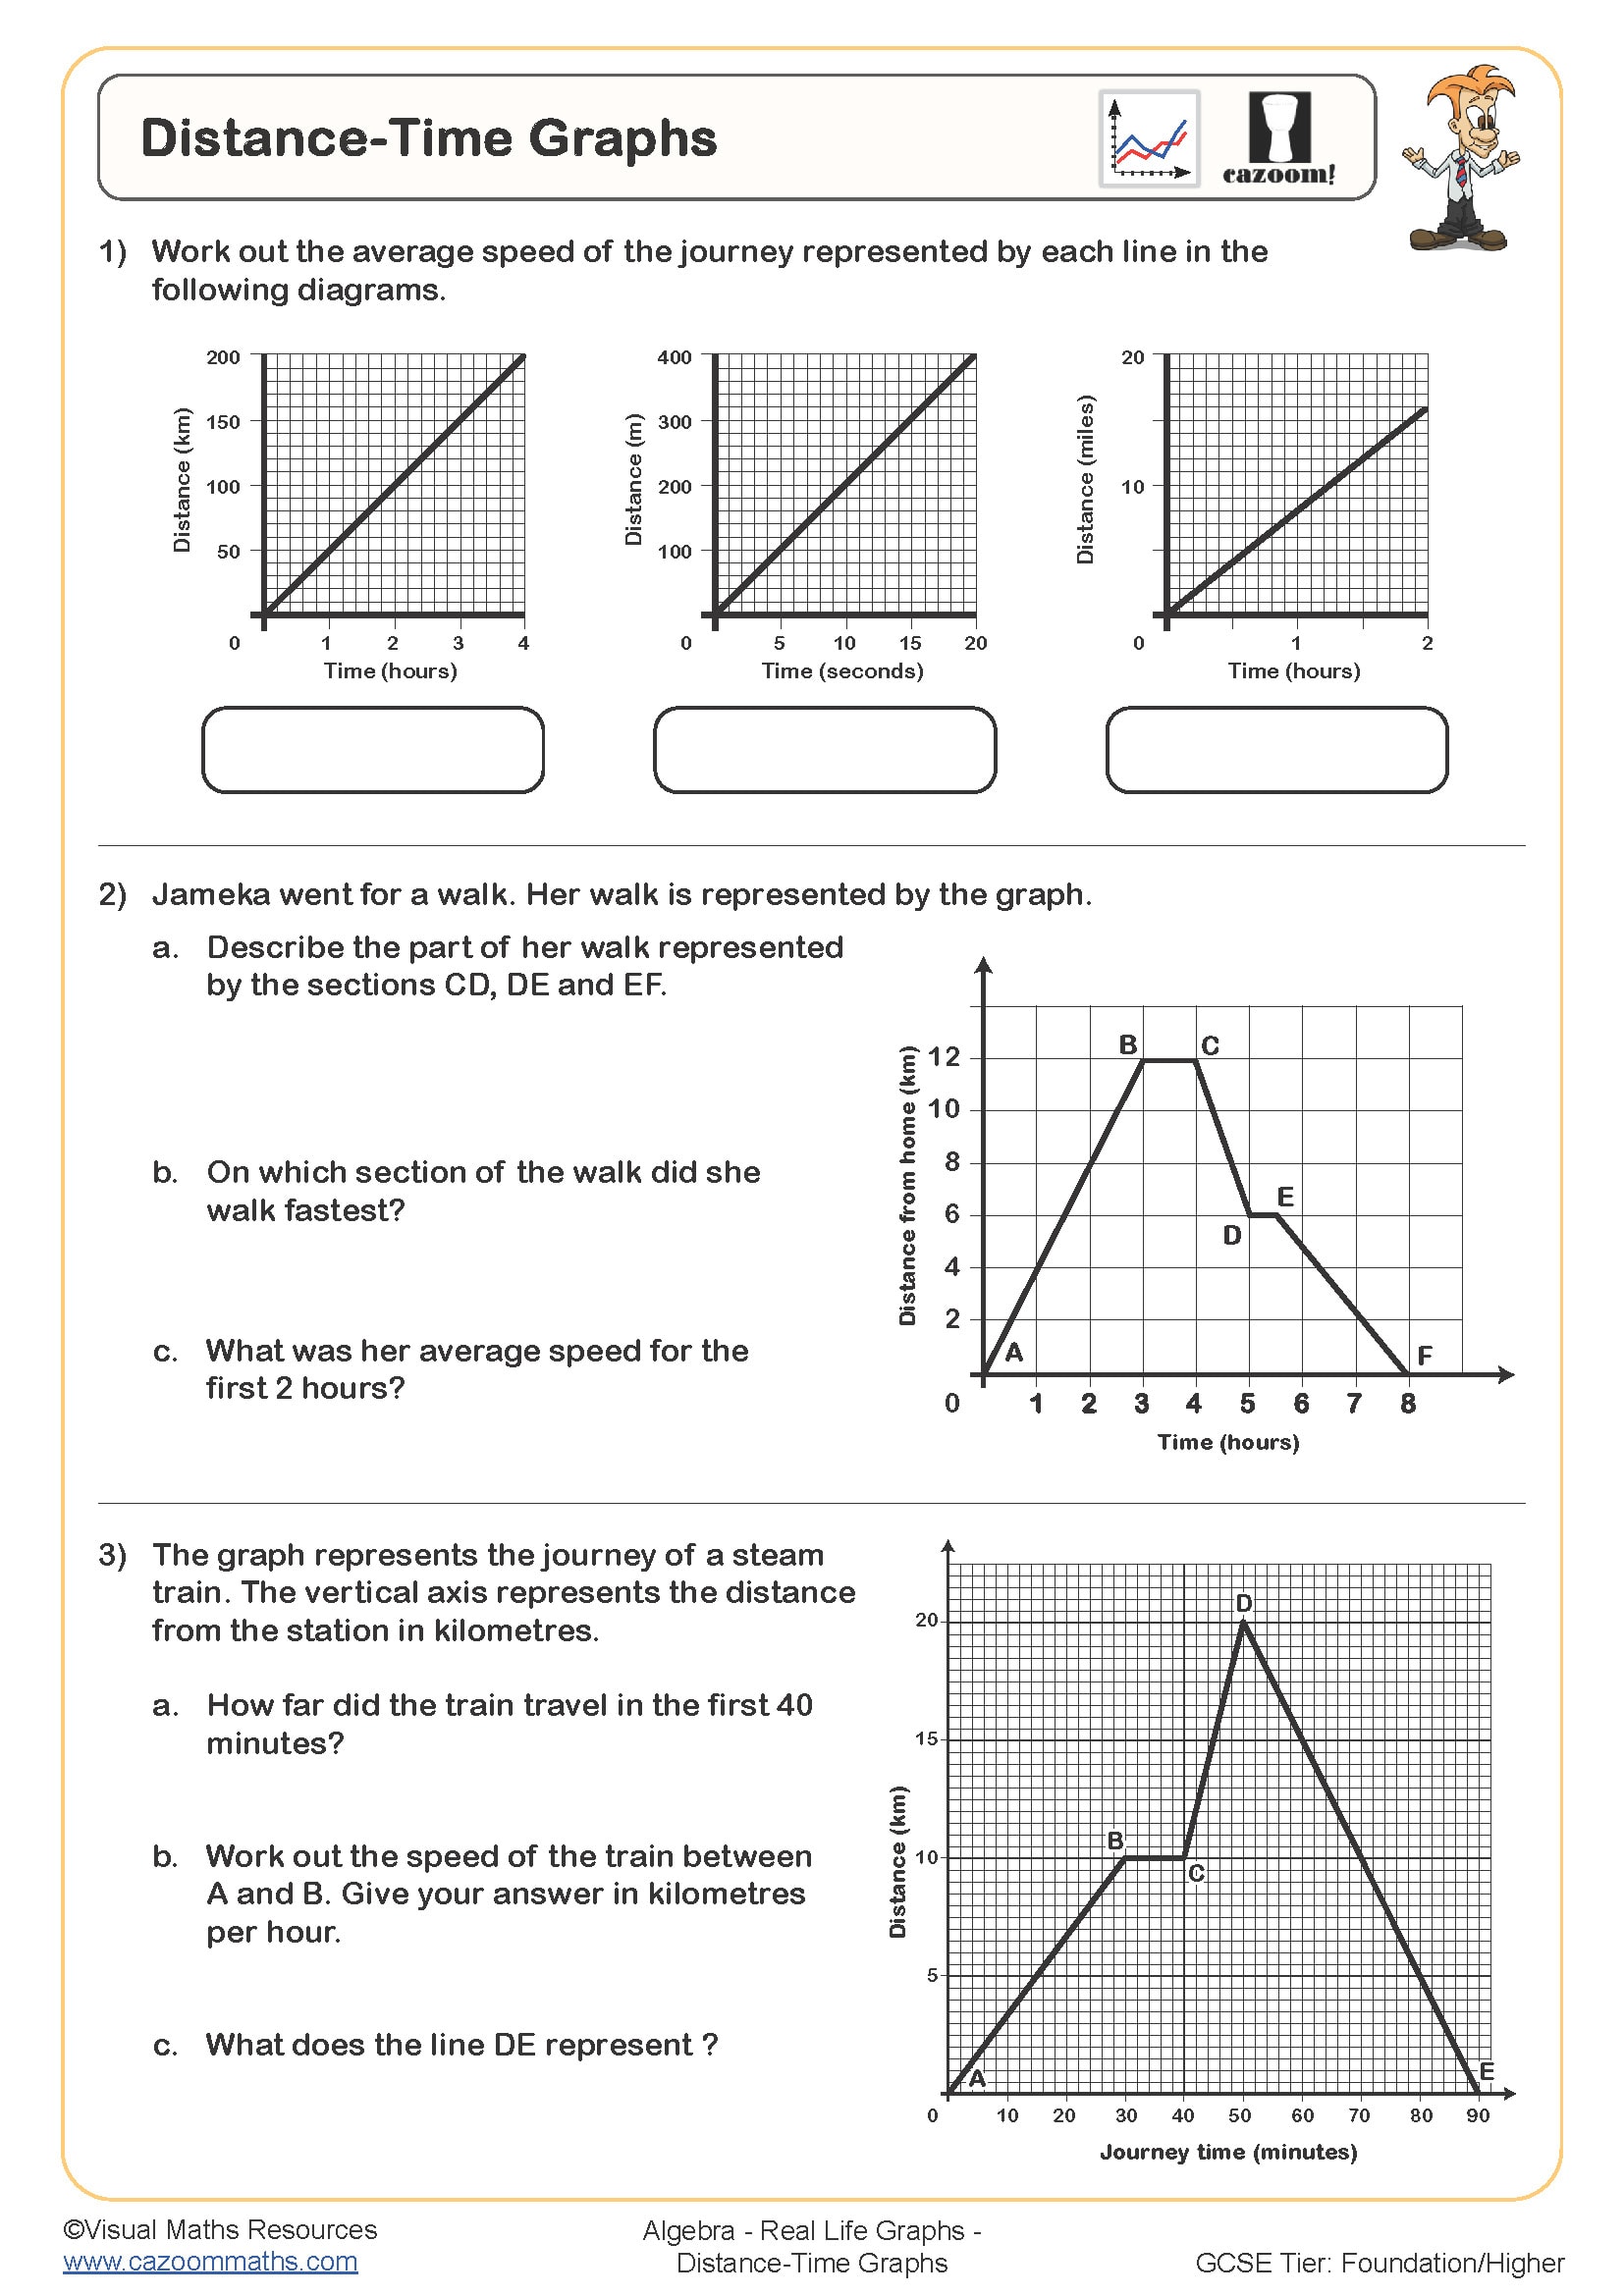
Distance-time Graphs Worksheet|KS3 Physics|Teachit
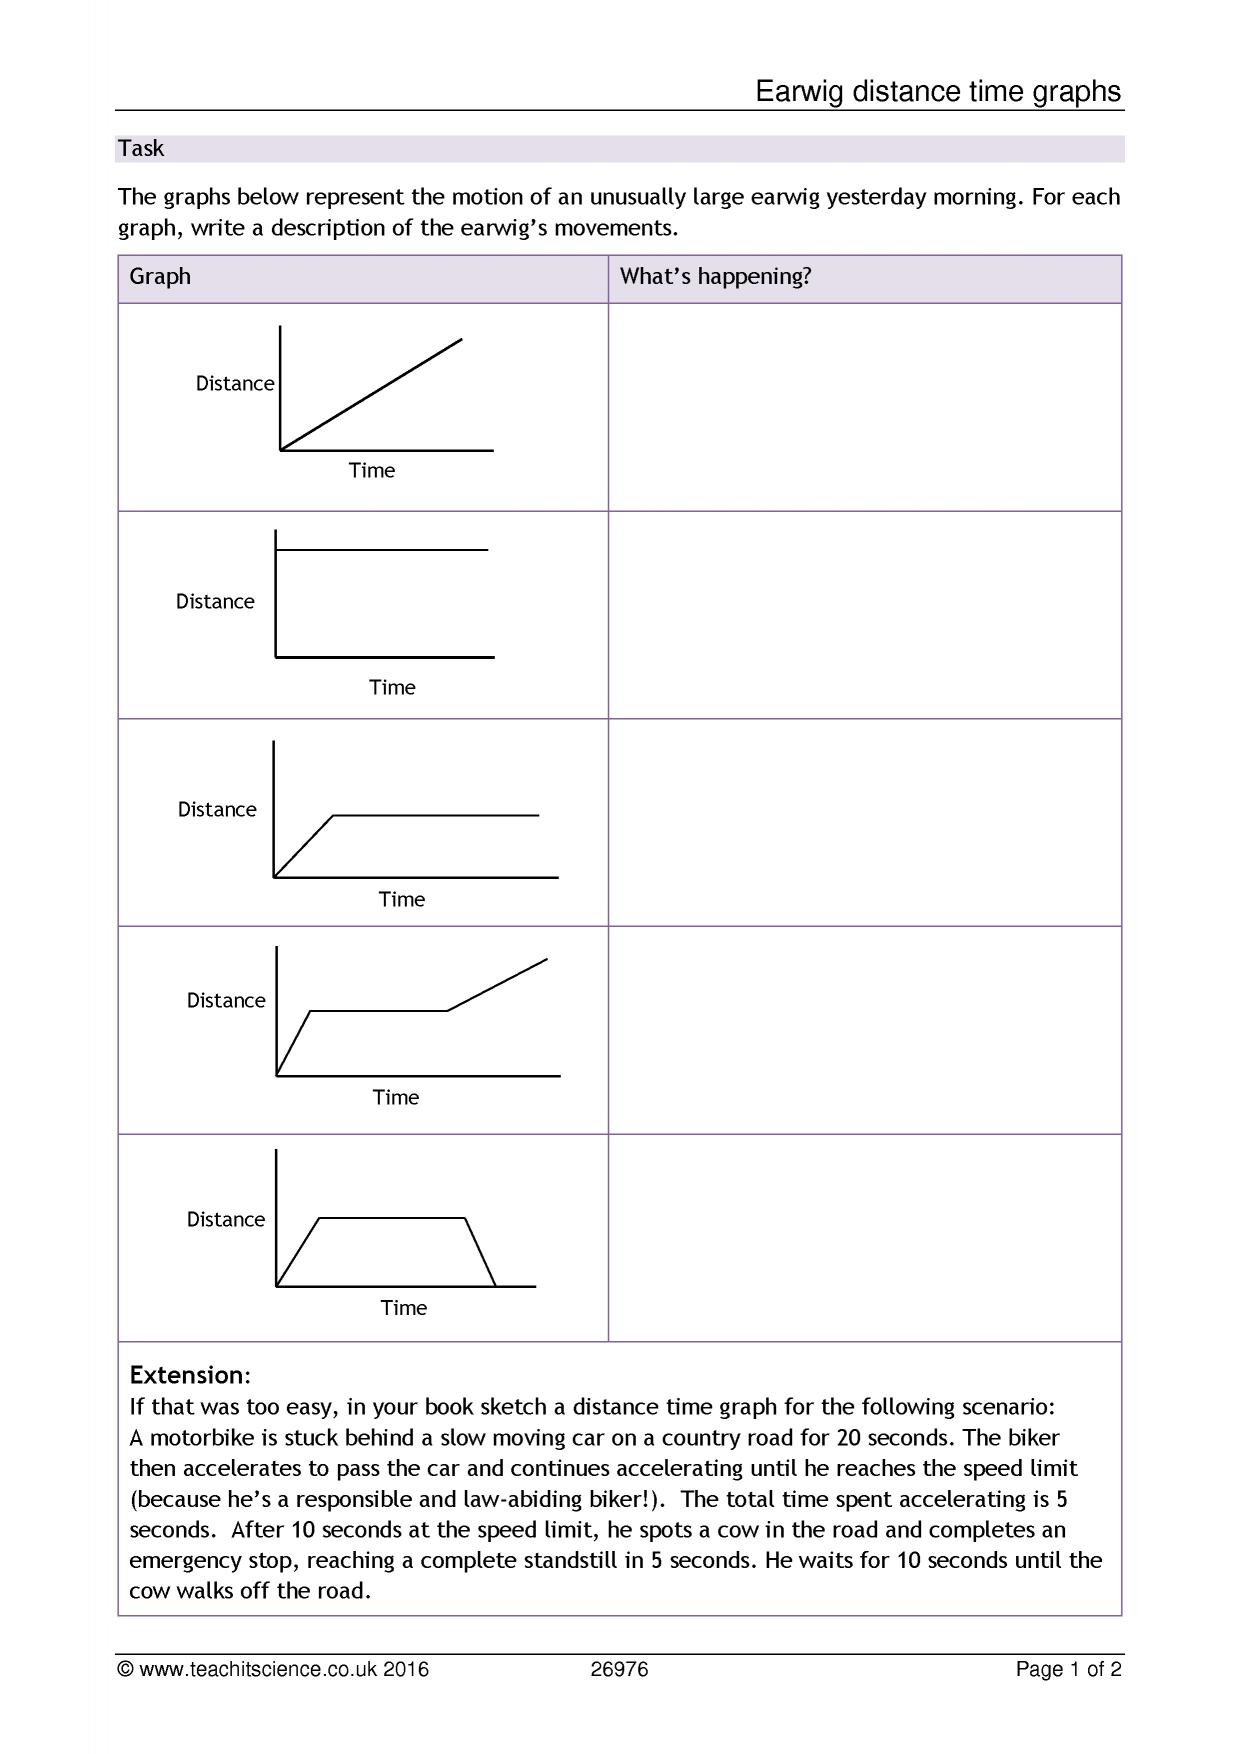
www.teachit.co.uk
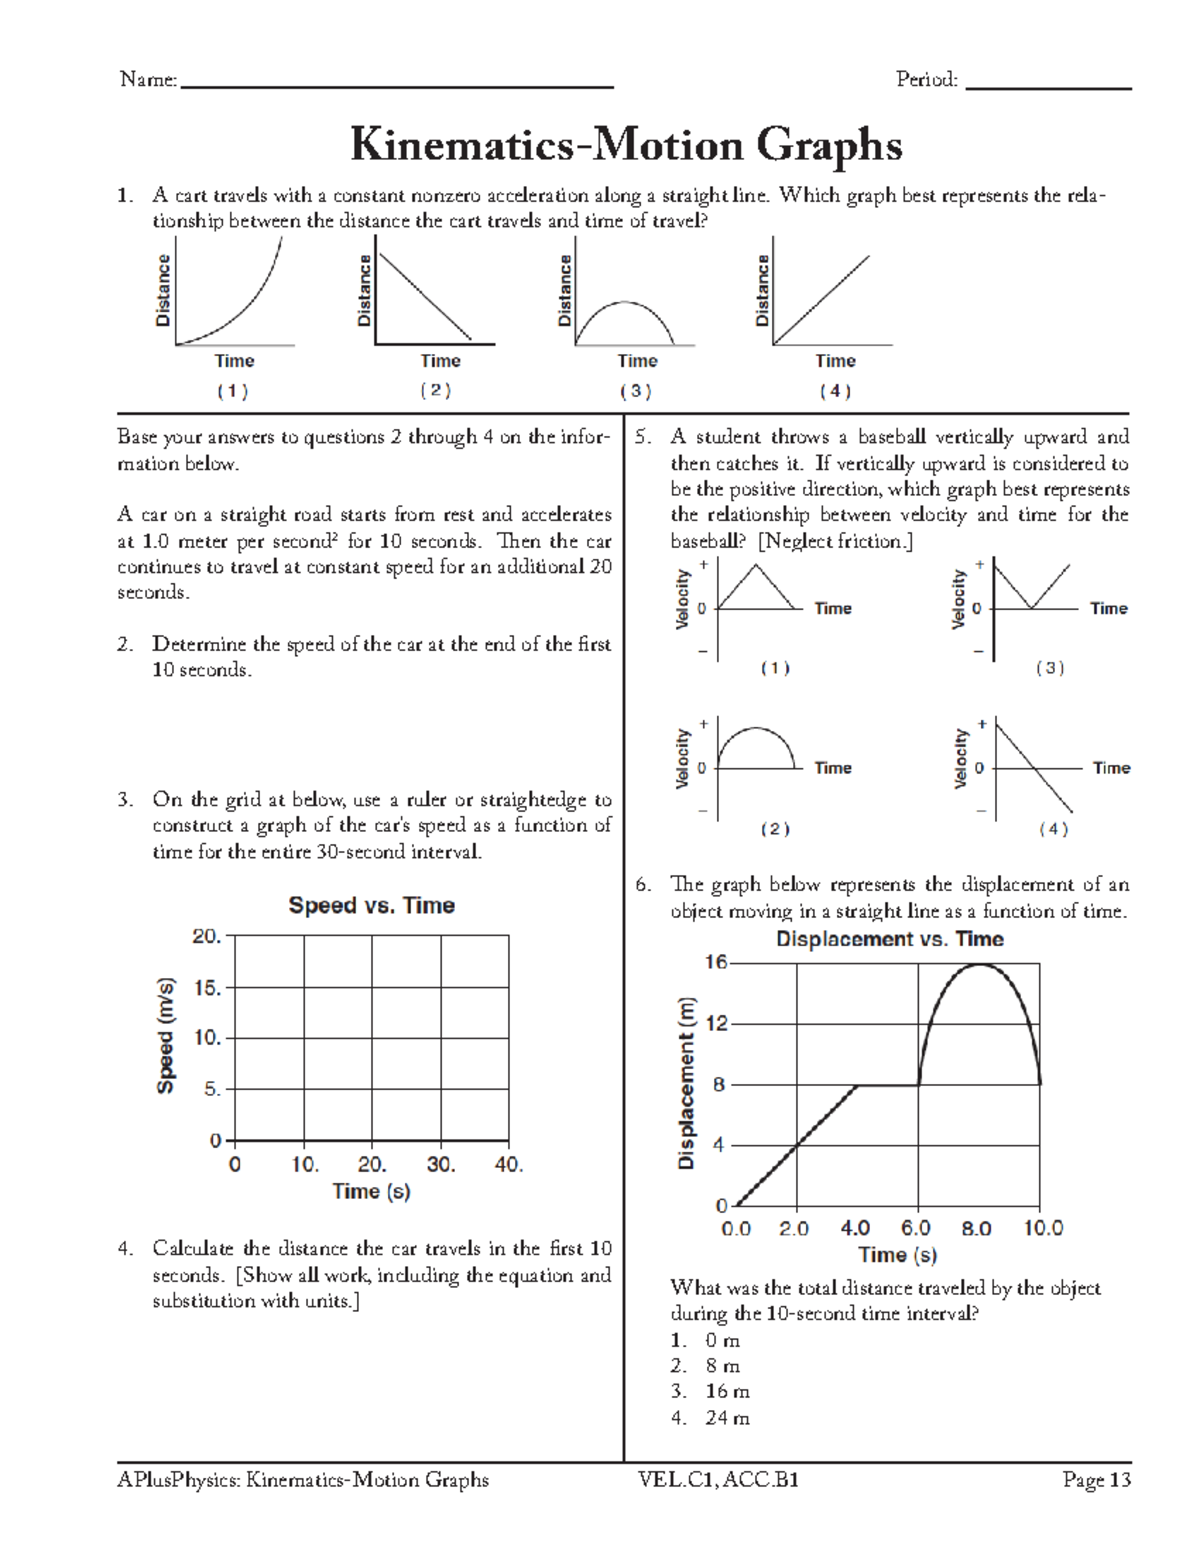
Kinematics Motion Graphs Worksheet – PHYS-18 – Studocu High School – US
www.studocu.com
Interpreting Motion Graphs – Worksheets Library

worksheets.clipart-library.com
Drawing Distance Time Graphs Worksheet Printable PDF, 53% OFF
www.pinnaxis.com
Motion Graphs Physics Worksheets – Worksheets Day

www.worksheetsday.com
Motion graphs. motion graphs worksheet|ks4 physics|teachit. 3-10a