Graphing linear inequalities is a fundamental skill in algebra, providing a visual representation of solutions that satisfy specific conditions. Mastering this skill is crucial for tackling more advanced topics like linear programming and systems of inequalities. Many students find this concept challenging initially, which is why practice using worksheets is invaluable. Working through a graphing linear inequalities worksheet, and then carefully checking your answers, is a surefire way to build confidence and understanding.
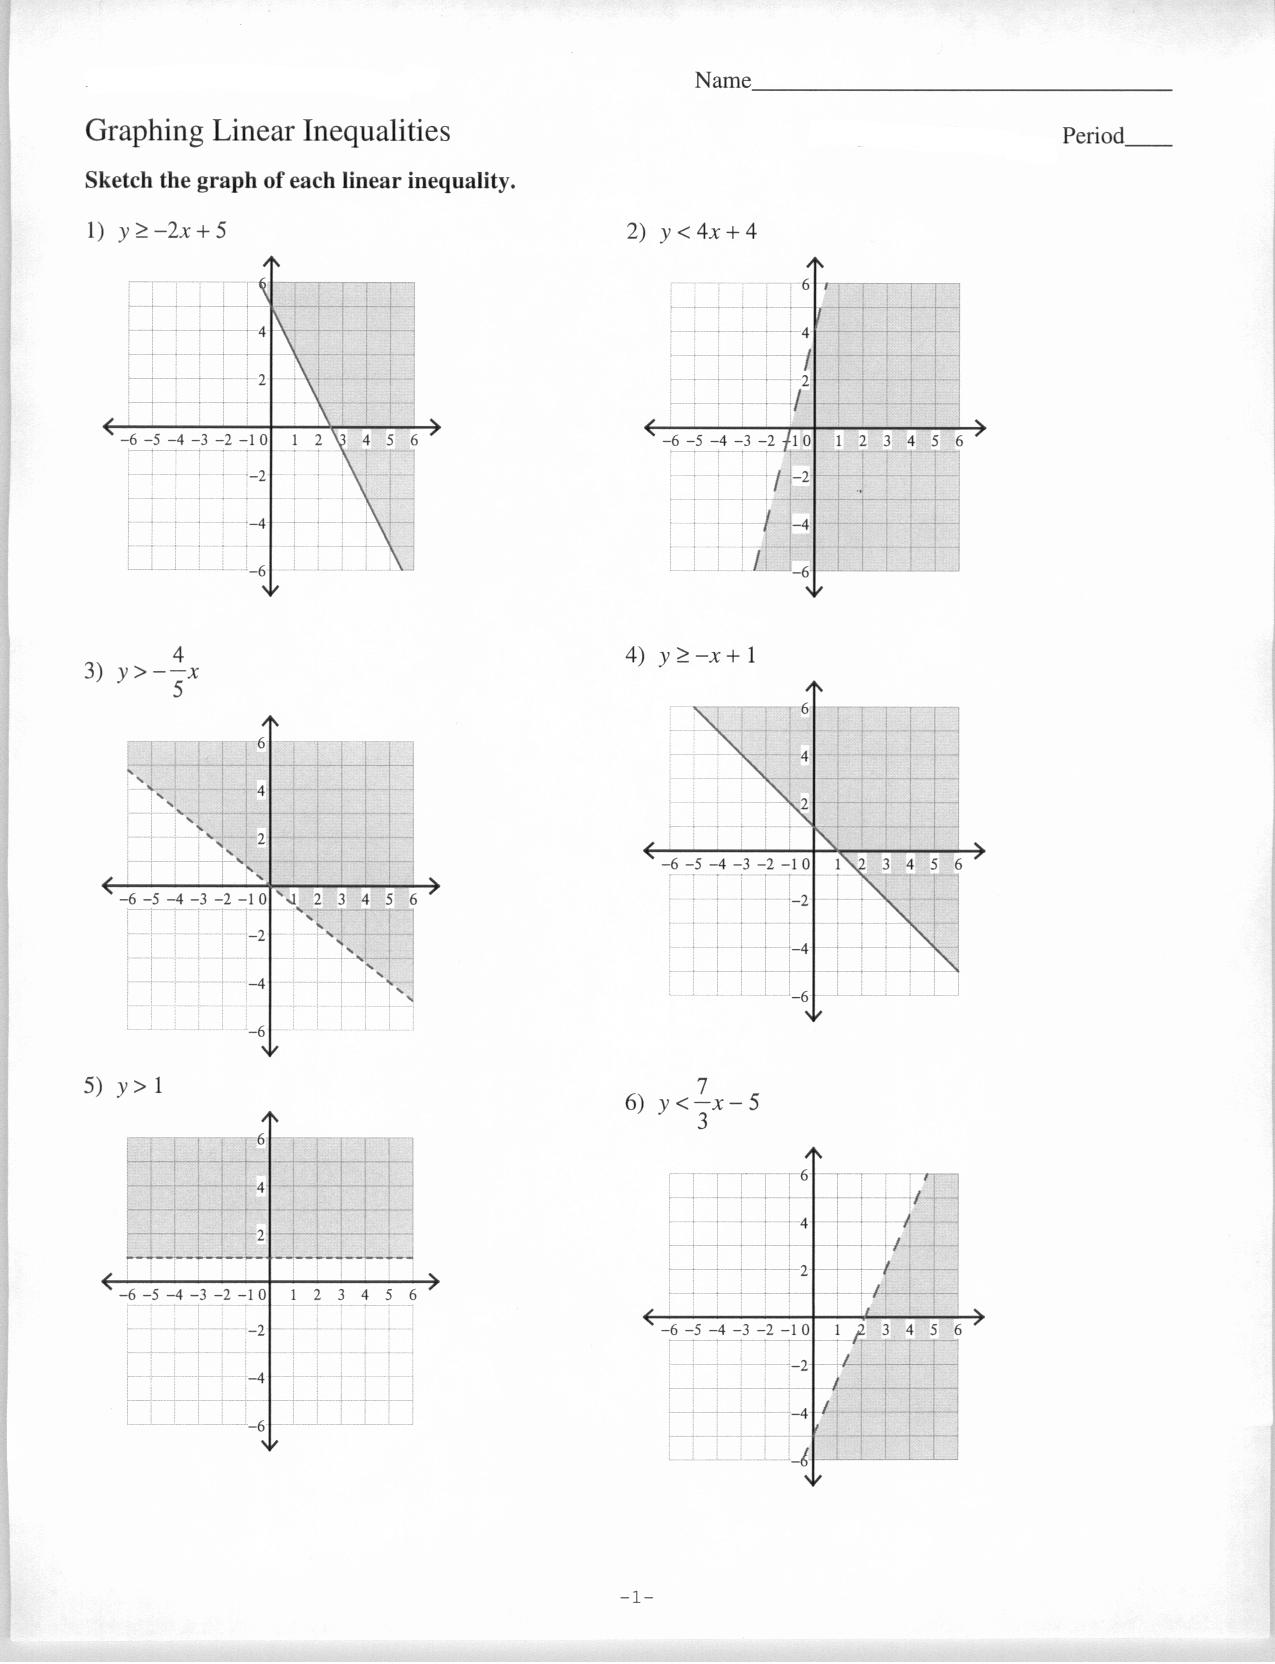
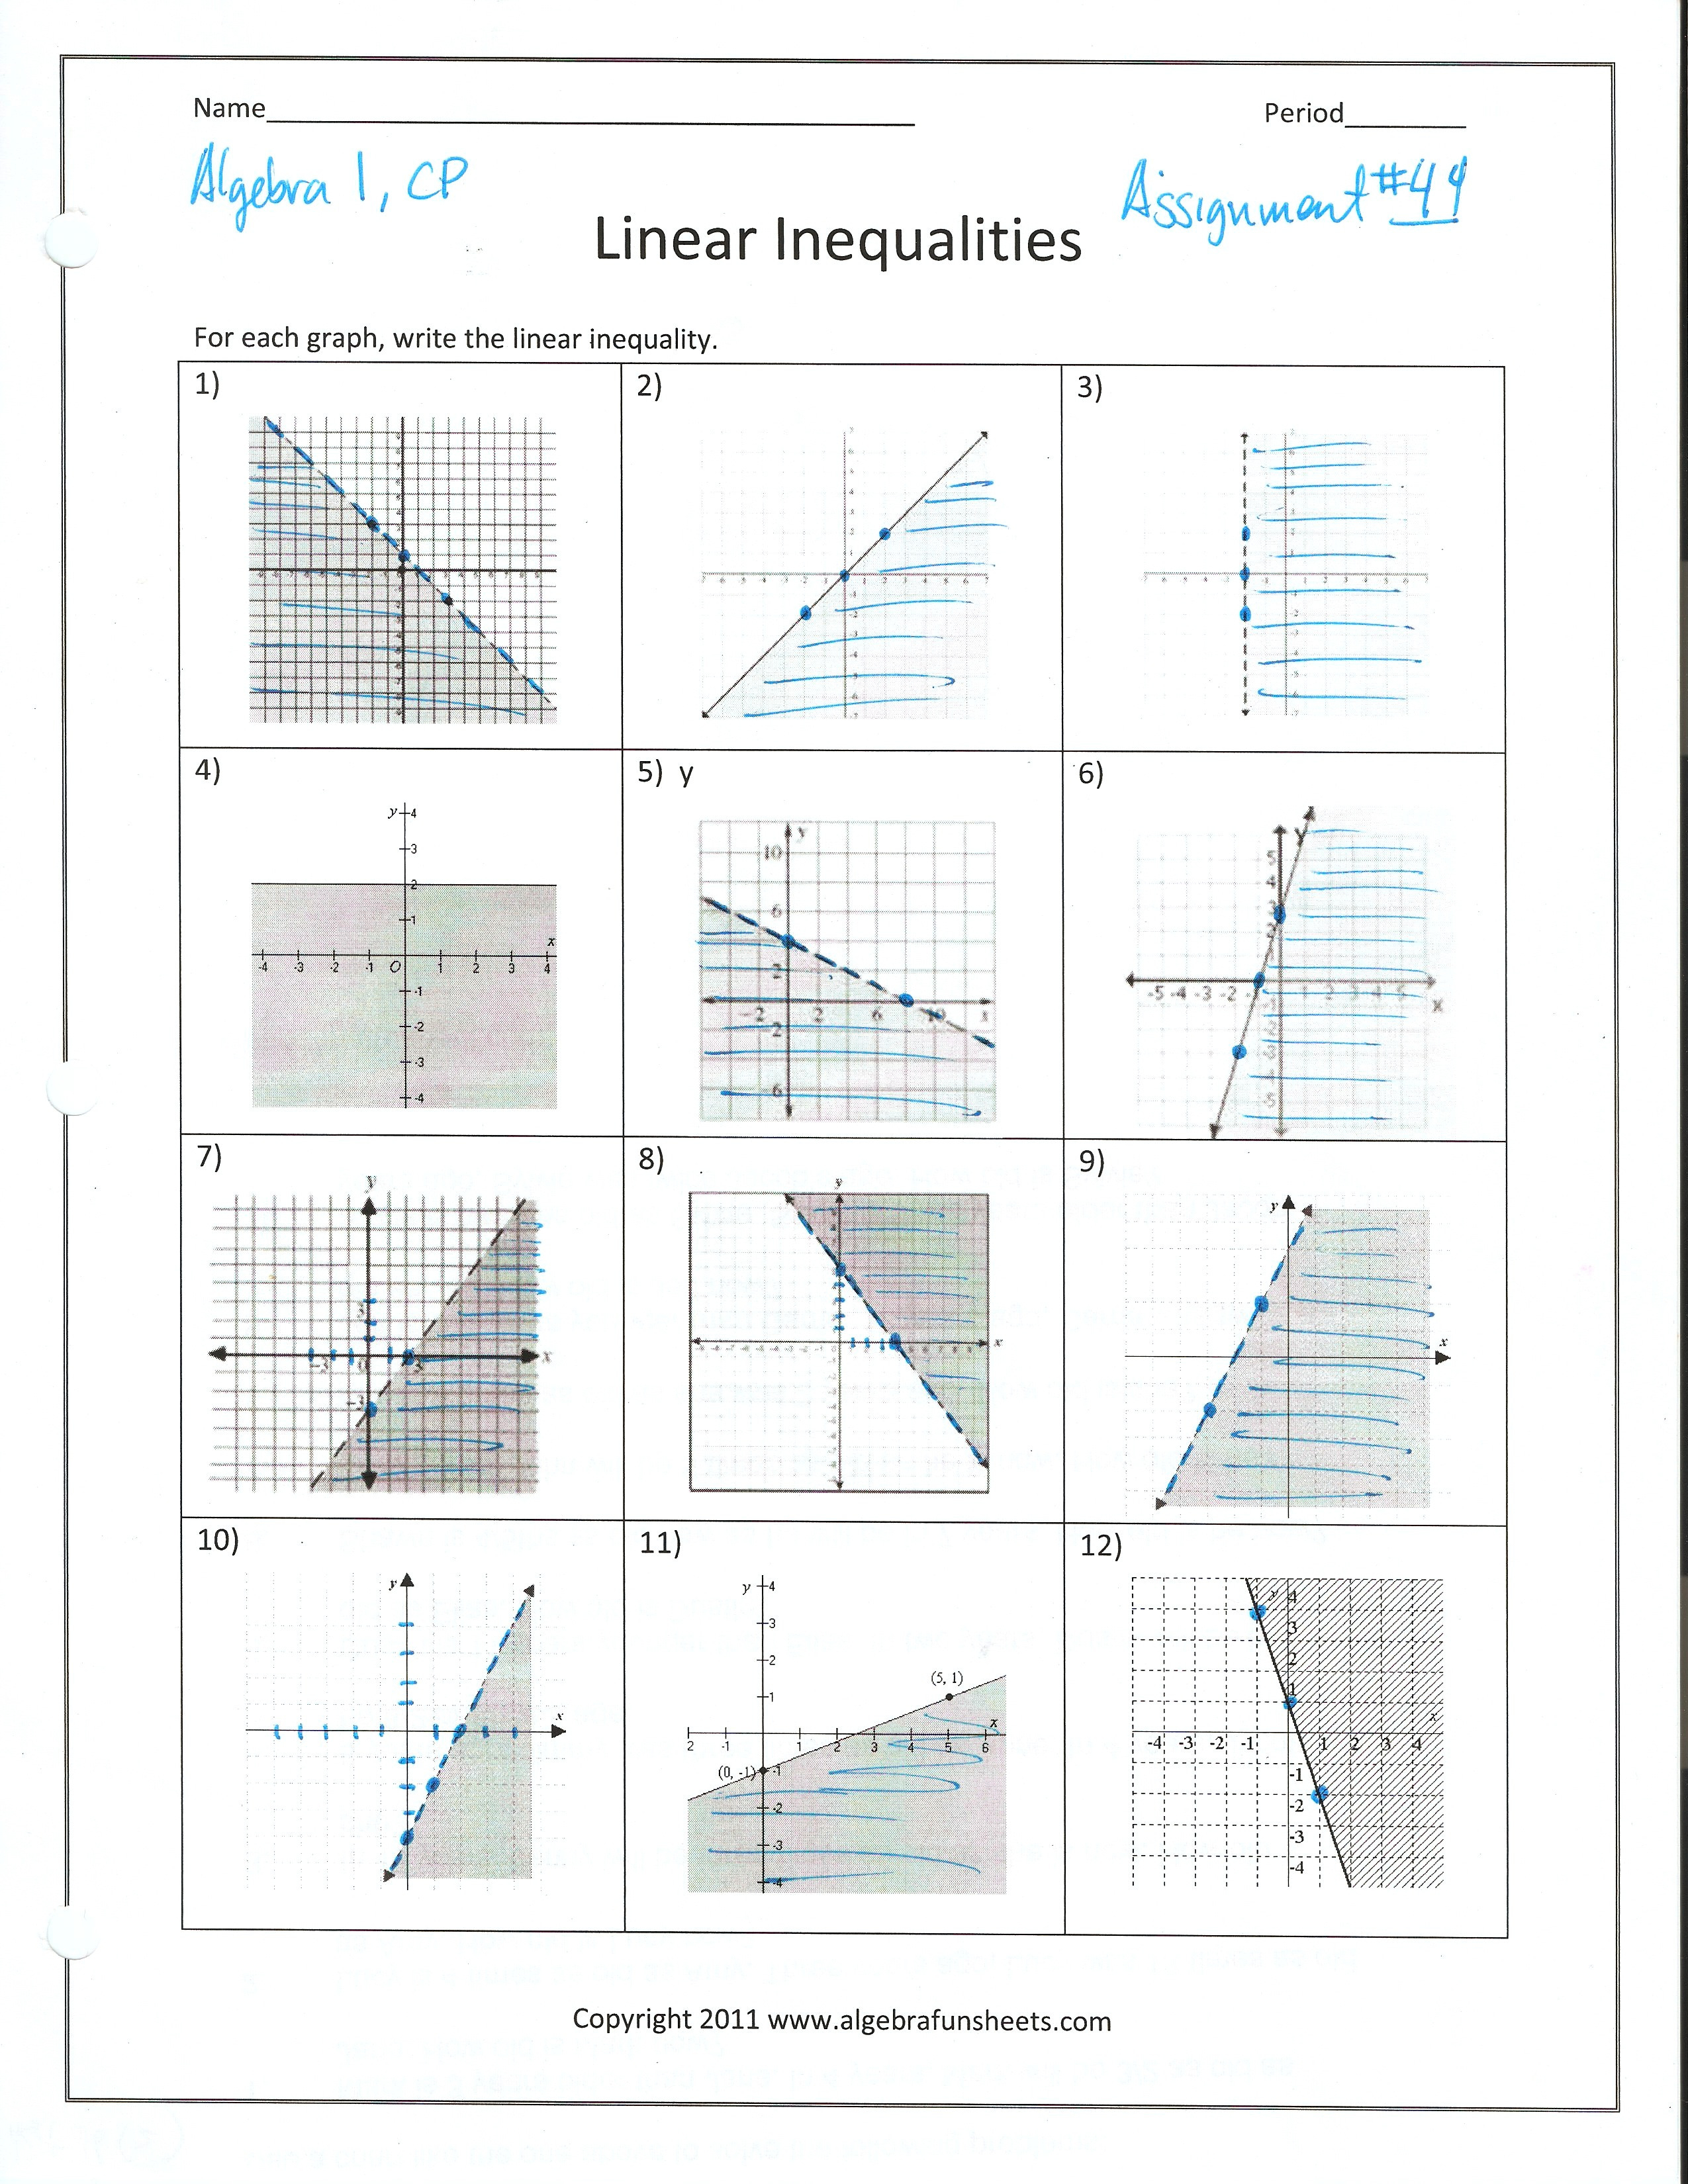
These worksheets typically present a variety of linear inequalities in two variables (usually x and y), requiring you to graph the solution set on a coordinate plane. The key is understanding the difference between solid and dashed lines, and which side of the line to shade to represent the solutions. Solid lines indicate that the points on the line are included in the solution set (≤ or ≥ inequalities), while dashed lines mean the points on the line are *not* included (< or > inequalities). Shading represents all the ordered pairs (x, y) that satisfy the inequality.
This post aims to provide example answers for a typical Graphing Linear Inequalities Worksheet. Remember, the process is more important than just memorizing the answers. Focus on understanding *why* the answer is what it is. Consider practicing by attempting the problems first and then checking against the examples. Understanding the concepts thoroughly will not only help you ace your homework but also prepare you for more complex mathematical challenges.
Graphing Linear Inequalities Worksheet: Sample Answers
Below are sample answers, visually described, for common types of linear inequalities you might encounter on a worksheet. Keep in mind that the precise numbers in your own problems will likely be different, but the process for graphing and shading remains the same.
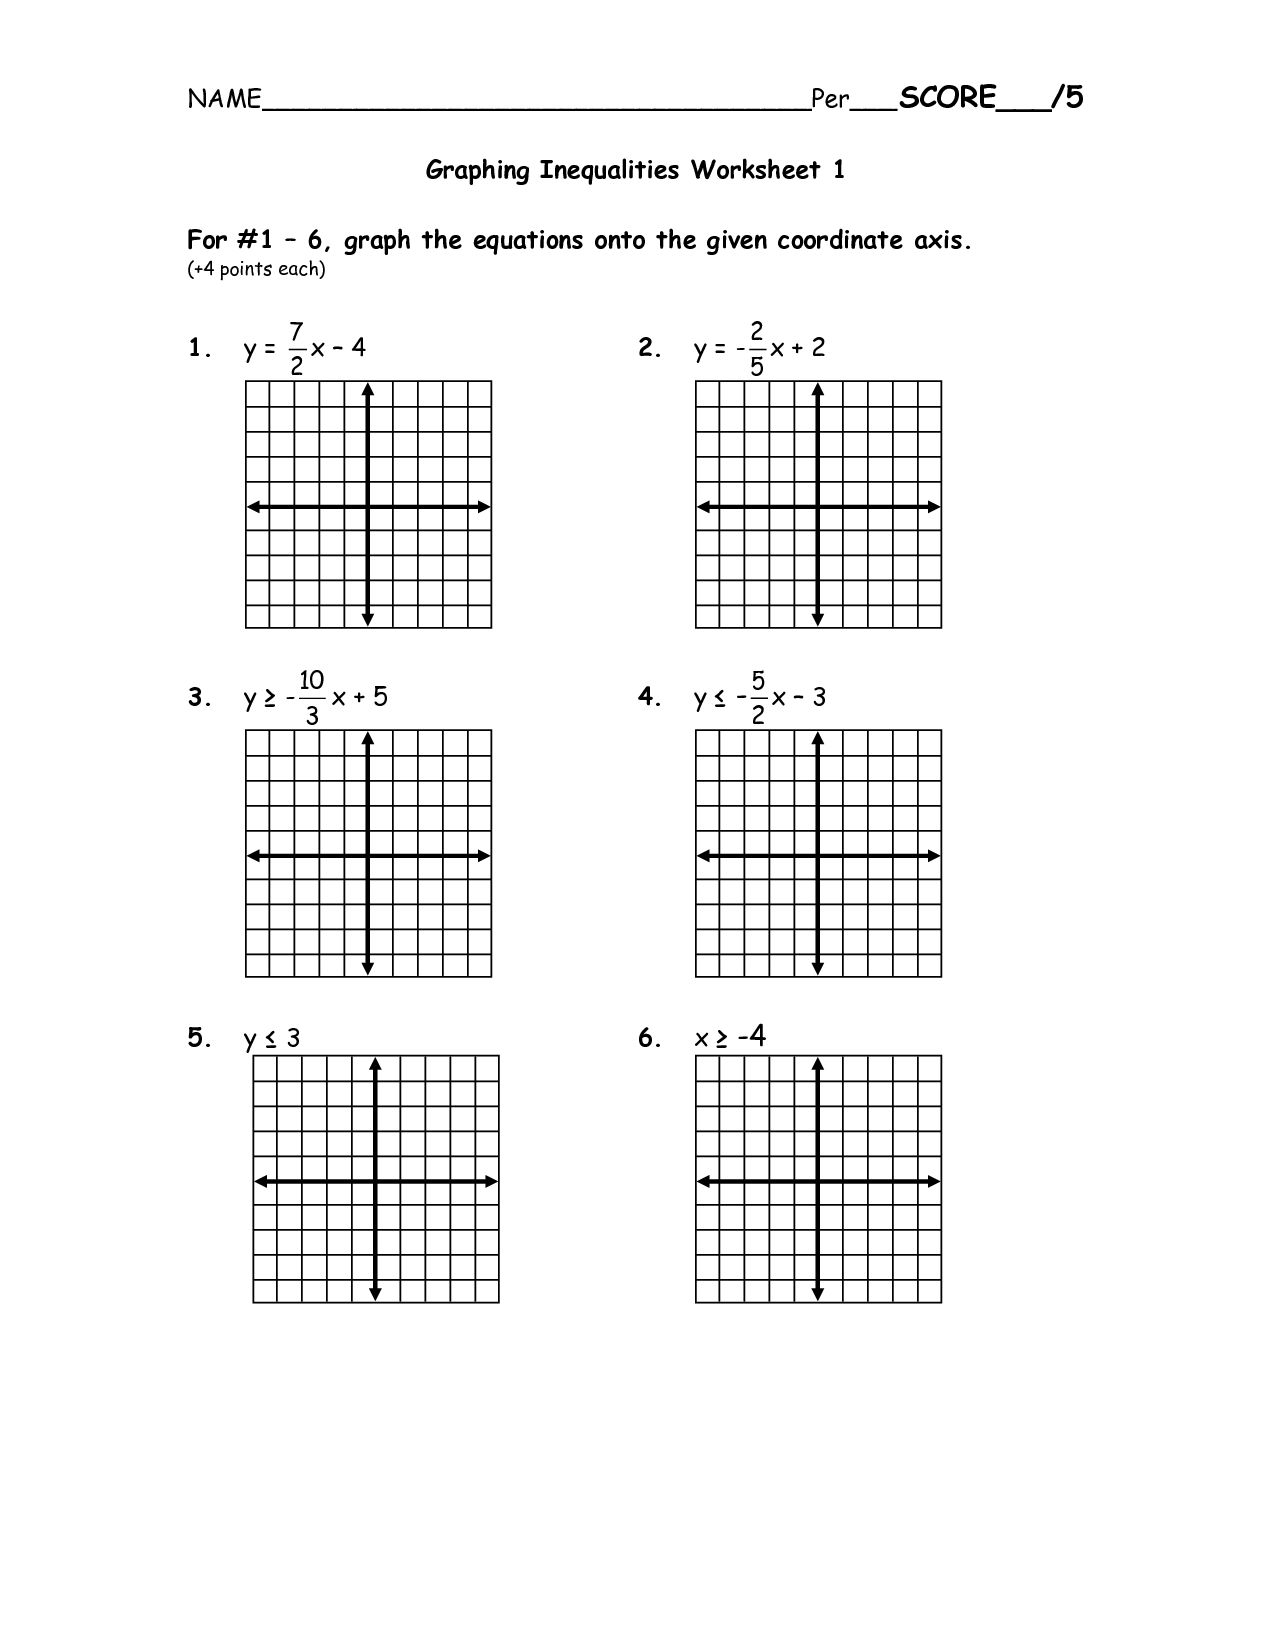
Example 1: y > 2x + 1
- Line Type: Dashed line (because of the ‘>’ symbol, indicating points on the line are not included).
- Slope-Intercept Form: Already in slope-intercept form, y = mx + b, where m (slope) = 2 and b (y-intercept) = 1.
- Graphing the Line: Start by plotting the y-intercept at (0, 1). Then, use the slope of 2 (which can be written as 2/1) to find another point. From (0, 1), move up 2 units and right 1 unit to reach the point (1, 3). Draw a dashed line through these points.
- Shading: Since the inequality is y > 2x + 1, we need to shade the region above the line. This means all points above the dashed line represent solutions to the inequality.
Example 2: y ≤ -x – 3
- Line Type: Solid line (because of the ‘≤’ symbol, indicating points on the line are included).
- Slope-Intercept Form: Already in slope-intercept form, y = mx + b, where m (slope) = -1 and b (y-intercept) = -3.
- Graphing the Line: Start by plotting the y-intercept at (0, -3). Then, use the slope of -1 (which can be written as -1/1) to find another point. From (0, -3), move down 1 unit and right 1 unit to reach the point (1, -4). Draw a solid line through these points.
- Shading: Since the inequality is y ≤ -x – 3, we need to shade the region below the line. This means all points below the solid line (and on the line itself) represent solutions to the inequality.
Example 3: x ≥ 4
- Line Type: Solid line (because of the ‘≥’ symbol, indicating points on the line are included).
- Graphing the Line: This is a vertical line that passes through x = 4. Draw a solid vertical line at x = 4.
- Shading: Since the inequality is x ≥ 4, we need to shade the region to the right of the line. This means all points to the right of the solid line (and on the line itself) represent solutions to the inequality.
Example 4: y < -2
- Line Type: Dashed line (because of the ‘<' symbol, indicating points on the line are not included).
- Graphing the Line: This is a horizontal line that passes through y = -2. Draw a dashed horizontal line at y = -2.
- Shading: Since the inequality is y < -2, we need to shade the region below the line. This means all points below the dashed line represent solutions to the inequality.
When completing your worksheet, double-check that you are using the correct type of line (solid or dashed) and that you are shading the correct region. If you have access to a graphing calculator or online graphing tool, use it to verify your solutions. Remember, consistent practice and attention to detail are key to mastering graphing linear inequalities.
If you are looking for Linear Inequalities By Graphing Investigation Printable Activity you’ve visit to the right page. We have 20 Pics about Linear Inequalities By Graphing Investigation Printable Activity like Edia | Free math homework in minutes – Worksheets Library, Free algebra 1 graphing linear inequalities worksheet, Download Free and also Free algebra 1 graphing inequalities worksheet, Download Free algebra 1. Here you go:
Linear Inequalities By Graphing Investigation Printable Activity

www.madebyteachers.com
Solve And Graph Linear Inequalities Worksheet
lessonlibreimbursed.z22.web.core.windows.net
9 Graphing Inequalities On A Number Line Worksheets / Worksheeto.com
www.worksheeto.com
Free Linear Inequalities Worksheet Answers, Download Free Linear

worksheets.clipart-library.com
9 Graphing Inequalities On A Number Line Worksheets / Worksheeto.com
www.worksheeto.com
Solving And Graphing Compound Inequalities Worksheet
worksheetpic101.s3.amazonaws.com
Inequalities Worksheet With Answers – E-streetlight.com
www.e-streetlight.com
Edia | Free Math Homework In Minutes – Worksheets Library

worksheets.clipart-library.com
Graphing Linear Equation Worksheets – Worksheets Library

worksheets.clipart-library.com
Free Algebra 2 Graphing Inequalities Worksheet, Download Free Algebra 2

worksheets.clipart-library.com
Graphing Linear Inequalities In 3 Easy Steps — Mashup Math

www.mashupmath.com
Free Algebra 1 Graphing Linear Inequalities Worksheet, Download Free

worksheets.clipart-library.com
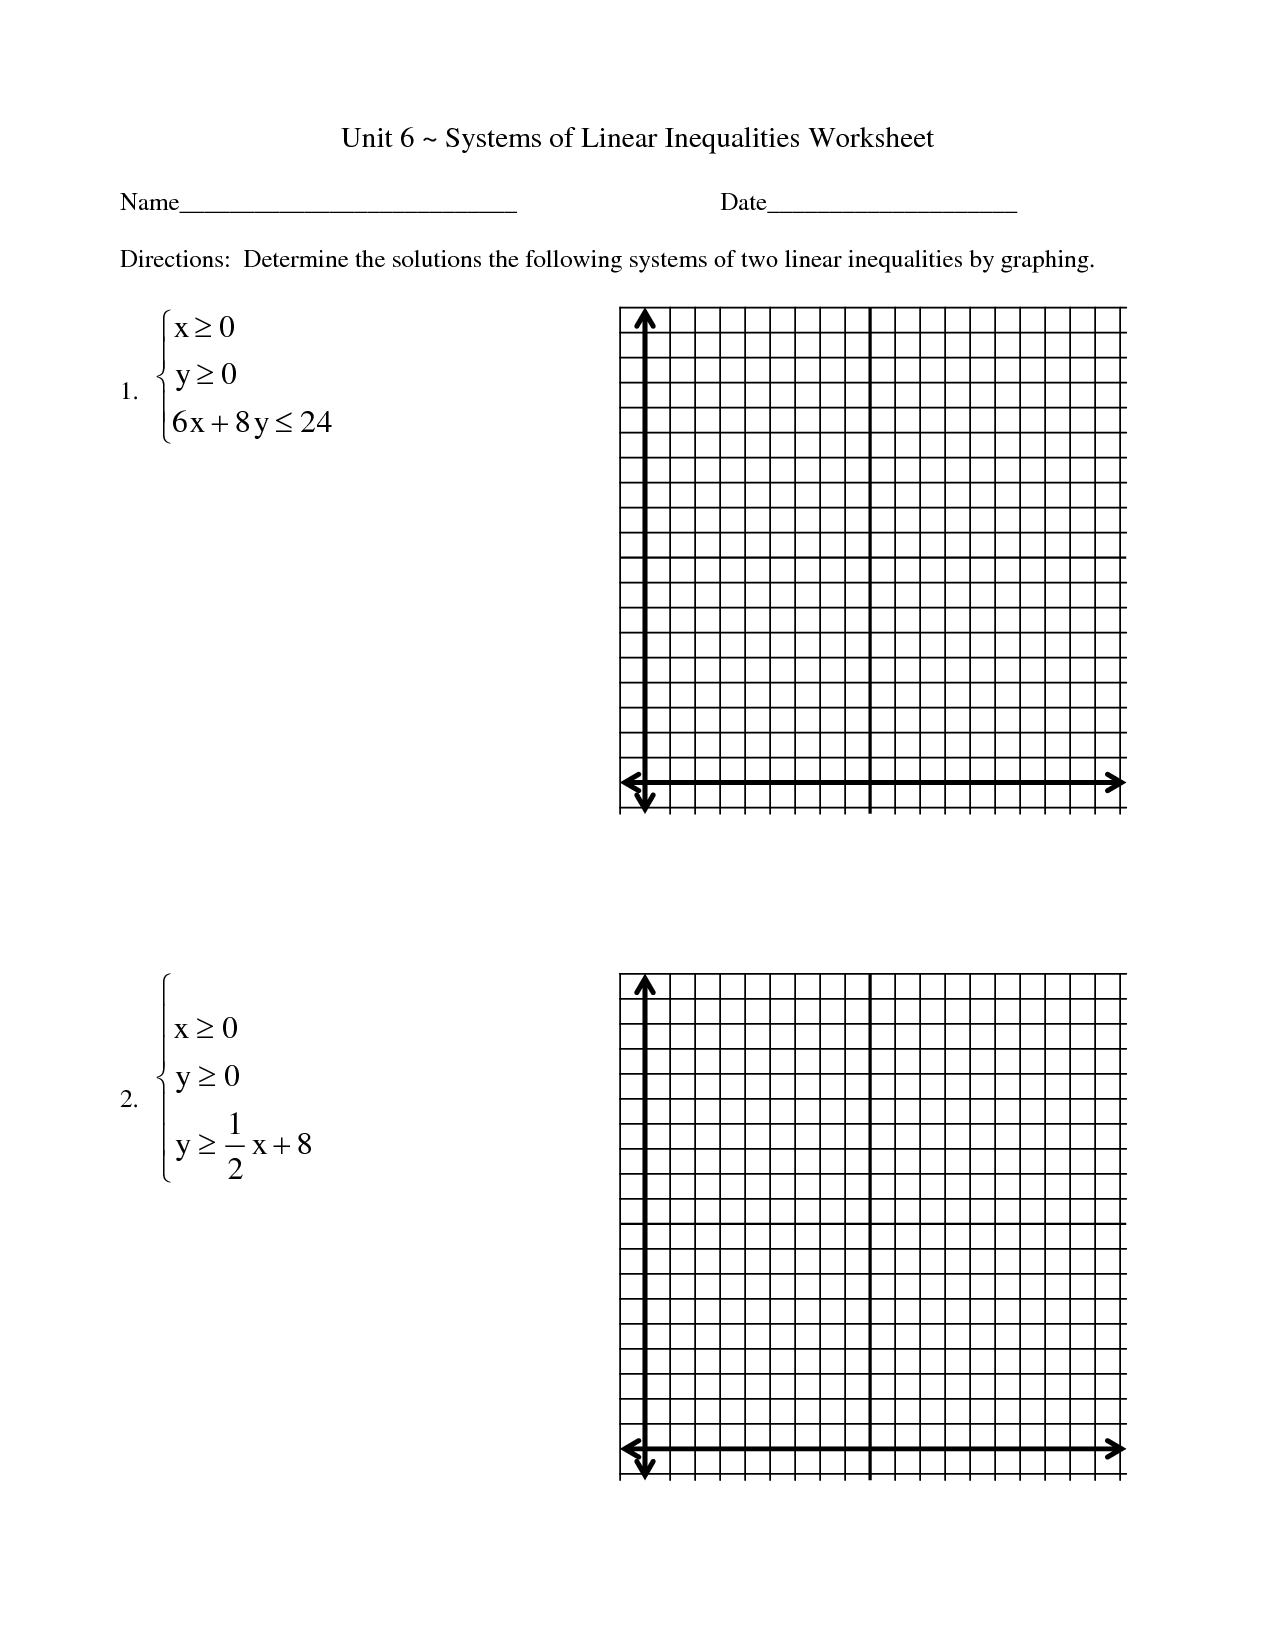
Free Solving Systems Of Linear Inequalities Worksheet Answers, Download

worksheets.clipart-library.com
Graphing Linear Inequalities Scavenger Hunt – All Things Algebra

worksheets.clipart-library.com
Inequalities Worksheets :Graphing Single Variable Inequalities

www.madebyteachers.com
Free Solving And Graphing Linear Inequalities Worksheet, Download Free

worksheets.clipart-library.com
Multi-Step Inequalities | Lecture Notes Algebra | Docsity – Worksheets

worksheets.clipart-library.com
Free Graphing Inequalities Worksheet With Answers, Download Free

worksheets.clipart-library.com
Graphing Linear Inequalities Worksheet Answers – E-streetlight.com
www.e-streetlight.com
Free Algebra 1 Graphing Inequalities Worksheet, Download Free Algebra 1

worksheets.clipart-library.com
Free solving and graphing linear inequalities worksheet, download free …. Free solving and graphing linear inequalities worksheet, download free. Solving and graphing compound inequalities worksheet