Understanding motion is fundamental to physics, and one of the most effective ways to visualize and analyze motion is through Distance vs. Time graphs. These graphs provide a visual representation of how an object’s distance from a reference point changes over a period of time. Mastering the interpretation of these graphs is crucial for grasping key concepts like speed, velocity, and acceleration.
A Distance vs. Time graph plots distance on the y-axis (vertical) and time on the x-axis (horizontal). The shape of the line on the graph tells a story about the object’s movement. A straight, upward-sloping line indicates constant speed, while a horizontal line indicates that the object is stationary. A steeper slope represents a higher speed, and a less steep slope represents a lower speed. Curves in the graph can indicate changing speeds or acceleration.
Many students struggle with interpreting these graphs initially. Common pitfalls include confusing distance with displacement, misunderstanding the significance of the slope, or failing to recognize different types of motion. That’s where a well-designed Distance vs. Time Graph Worksheet comes in handy. These worksheets typically present various graphs and ask questions that prompt students to analyze the information presented and draw conclusions about the object’s movement.
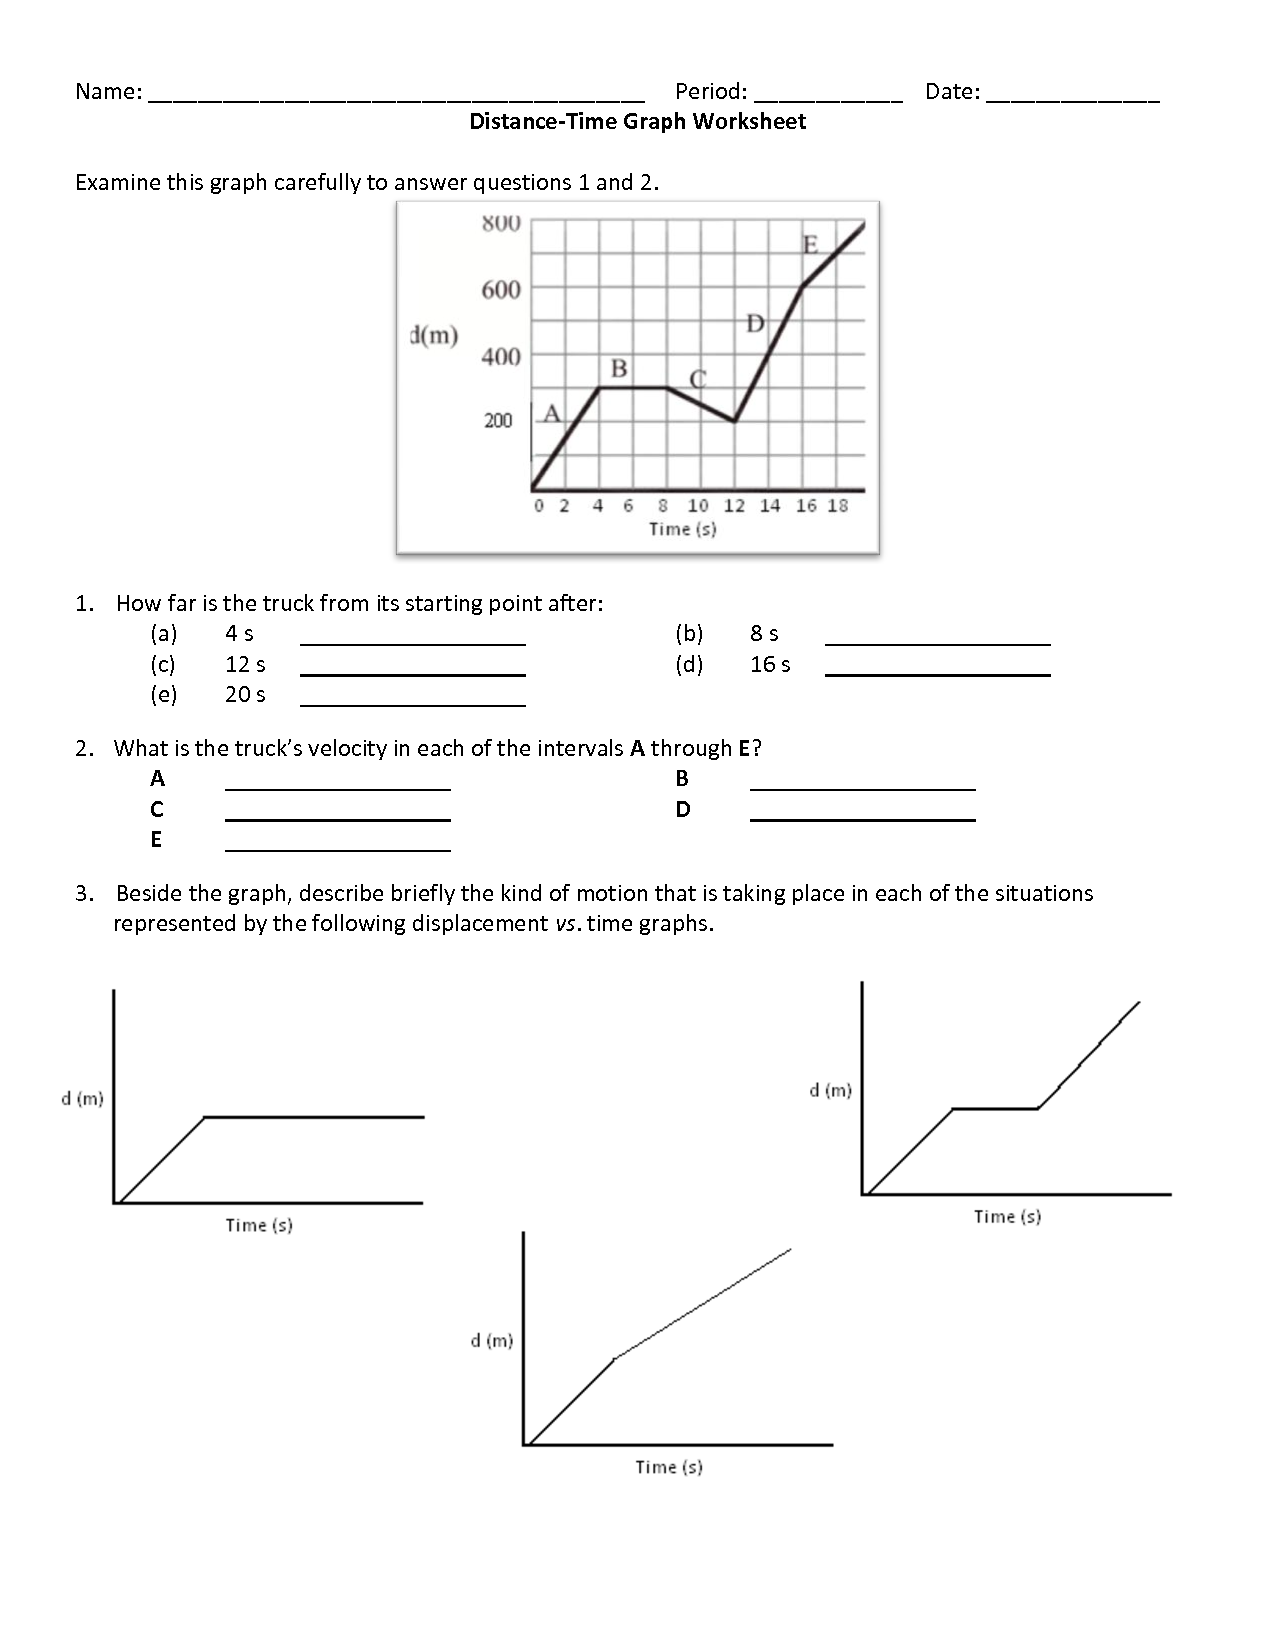
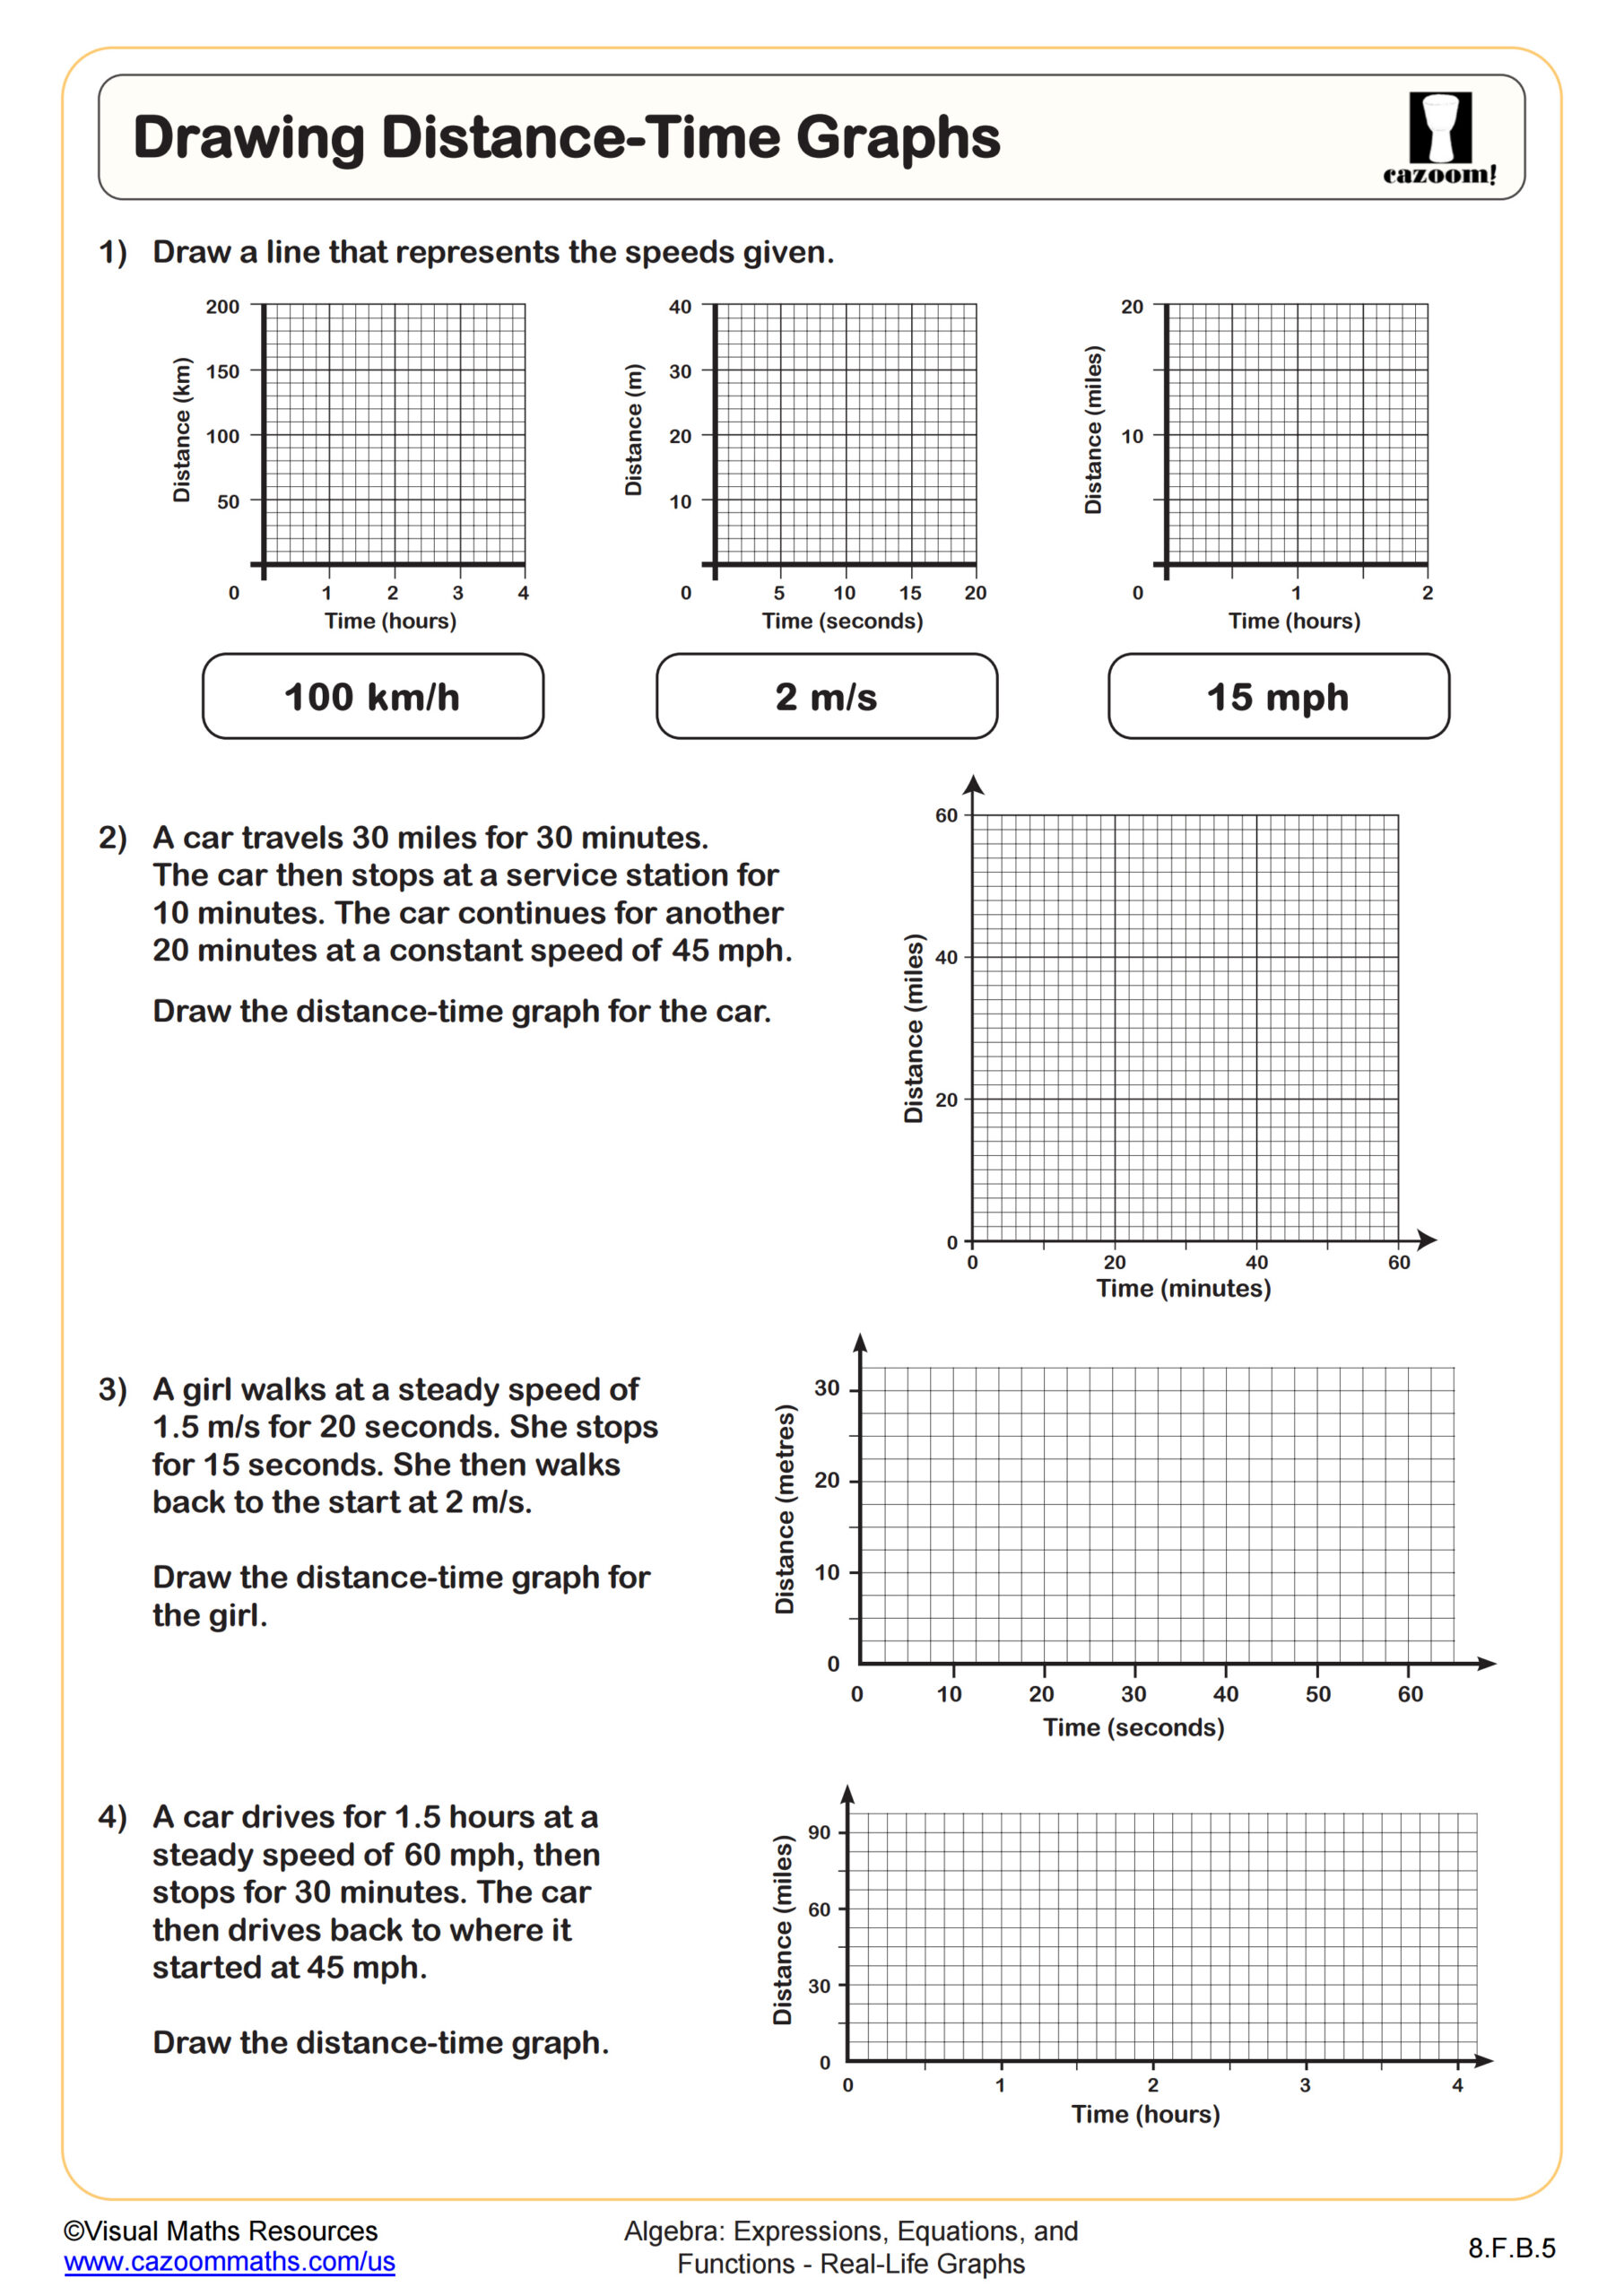
For example, a worksheet might show a graph with three distinct sections: a straight line with a positive slope, a horizontal line, and another straight line with a positive, but steeper, slope. The questions might then ask:
*
During which time interval was the object moving the fastest?
*
During which time interval was the object stationary?
*
What was the total distance traveled by the object?
*
What was the average speed of the object over the entire duration represented on the graph?
Solving these problems not only reinforces the understanding of distance vs. time graphs but also develops critical thinking and problem-solving skills. The ability to extrapolate data from a visual representation and apply it to real-world scenarios is a valuable skill that extends beyond the physics classroom.
Below, you’ll find the answers to a sample Distance vs. Time Graph Worksheet. While the exact questions will vary depending on the worksheet, the principles and methodologies used to arrive at the solutions remain the same.
Sample Distance vs. Time Graph Worksheet Answers
Assuming a Distance vs. Time graph with segments representing various types of motion, here are the types of questions you might expect and how to approach them:
Interpreting the Graph
-
Question: During which time interval was the object stationary?
Answer: The object was stationary during the time interval where the line on the graph is horizontal. Let’s assume this occurs between t = 2 seconds and t = 5 seconds. -
Question: During which time interval was the object moving the fastest?
Answer: The object was moving the fastest during the time interval where the line has the steepest slope. Let’s say this occurs between t = 5 seconds and t = 8 seconds. -
Question: What was the total distance traveled by the object?
Answer: To find the total distance, you need to look at the final distance value on the graph. Let’s assume the final distance at t = 10 seconds is 20 meters. So, the total distance traveled is 20 meters. -
Question: What was the average speed of the object over the entire duration represented on the graph?
Answer: Average speed is calculated as total distance divided by total time. In this case, the total distance is 20 meters, and the total time is 10 seconds. Therefore, the average speed is 20 meters / 10 seconds = 2 meters per second. -
Question: Calculate the speed of the object between t = 0 seconds and t = 2 seconds, assuming the distance at t=2 seconds is 5 meters.
Answer: Speed is calculated by finding the slope of the line during this interval. The change in distance is 5 meters – 0 meters = 5 meters. The change in time is 2 seconds – 0 seconds = 2 seconds. Therefore, the speed during this interval is 5 meters / 2 seconds = 2.5 meters per second. -
Question: What is the displacement between t=0 and t=10?
Answer: Displacement is the change in position between the start and end time. Assuming the starting point is 0 meters and the ending point (at t=10) is 20 meters, the displacement is 20 meters – 0 meters = 20 meters.
If you are searching about Distance Time Graph Worksheet With Answers – Goorganic you’ve visit to the right place. We have 20 Images about Distance Time Graph Worksheet With Answers – Goorganic like 50 Distance Vs Time Graph Worksheet in 2023 | Graphing worksheets, Distance Vs Time Graph Worksheet – Ame.my.id and also Interpreting Distance Time Graphs Worksheet. Here it is:
Distance Time Graph Worksheet With Answers – Goorganic
goorganic71.blogspot.com
Distance Vs Time Graph Worksheet – Ame.my.id
ame.my.id
Distance Vs Time Graph Worksheet – E-streetlight.com
www.e-streetlight.com
Interpreting Distance Time Graphs Worksheet

quizzcampusdanae.z19.web.core.windows.net
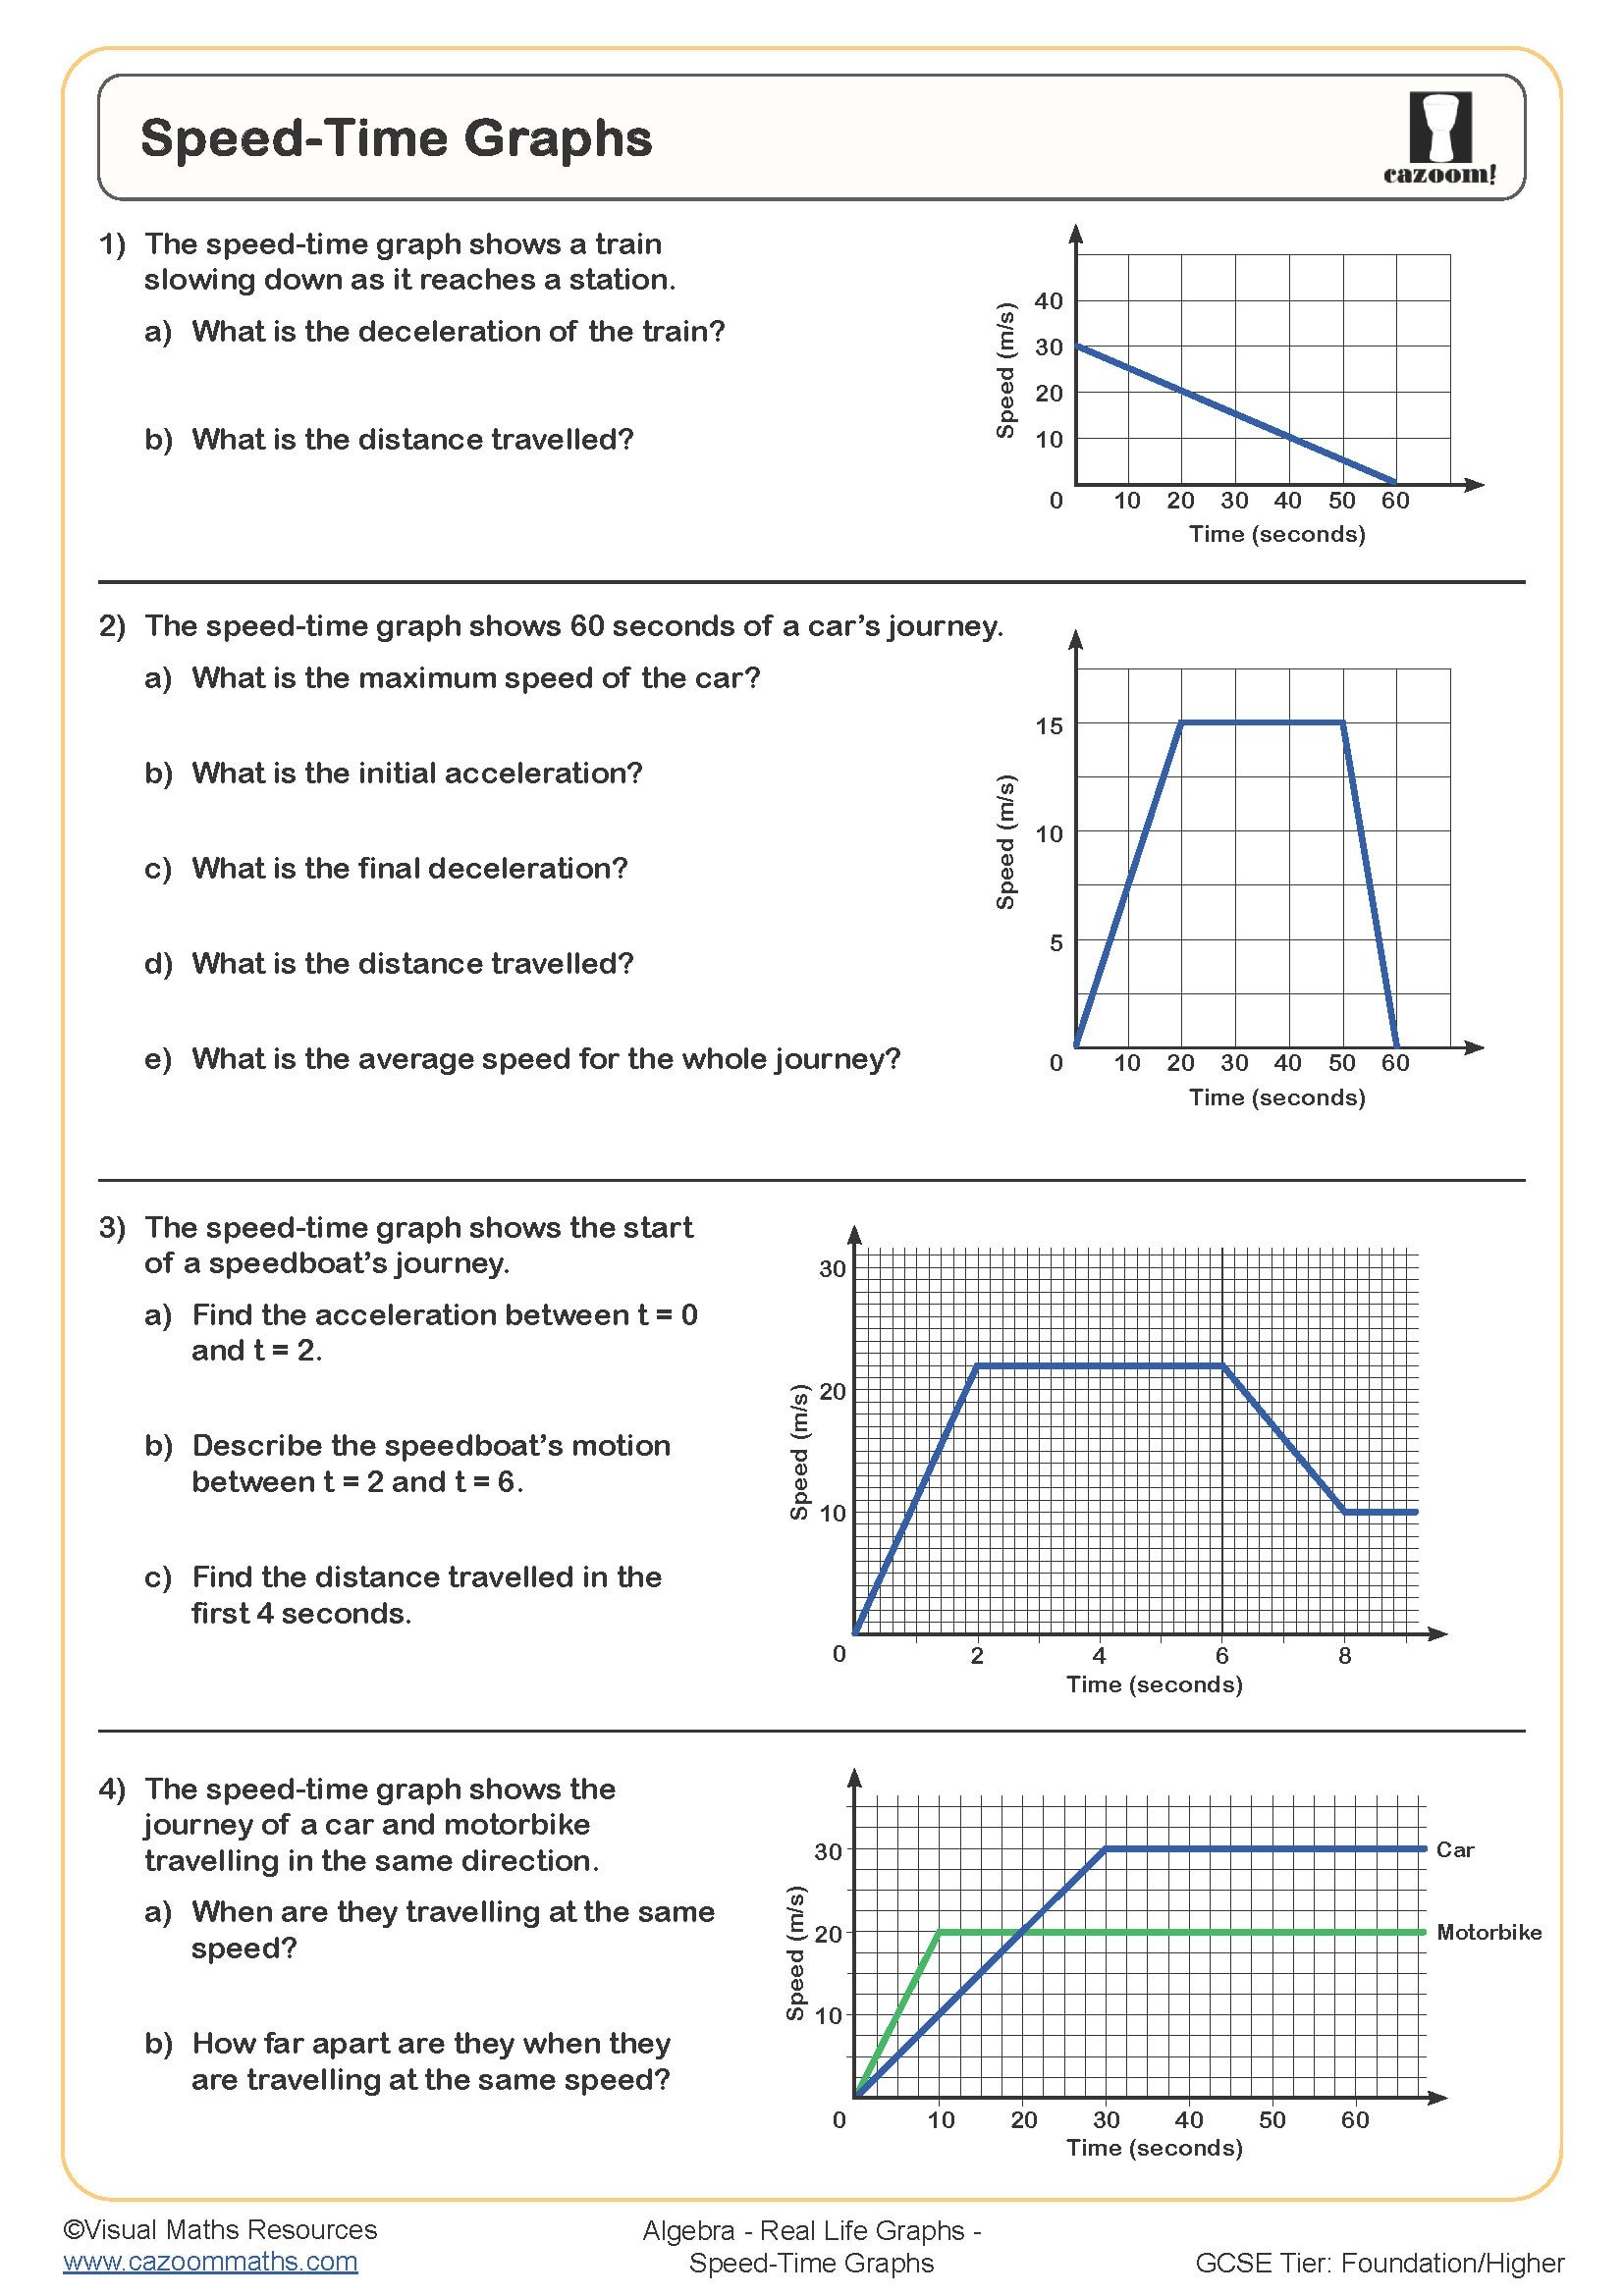
Drawing Speed Time Graphs Worksheet | Printable Maths Worksheets

www.cazoommaths.com
Graphing Distance Vs Time Worksheet – Printable And Enjoyable Learning

newark2.remotepc.com
Speed Time Graph Worksheet – Worksheets Printable Free
wks.udlvirtual.edu.pe
Free Distance Time Graphs Worksheet, Download Free Distance Time Graphs
worksheets.clipart-library.com
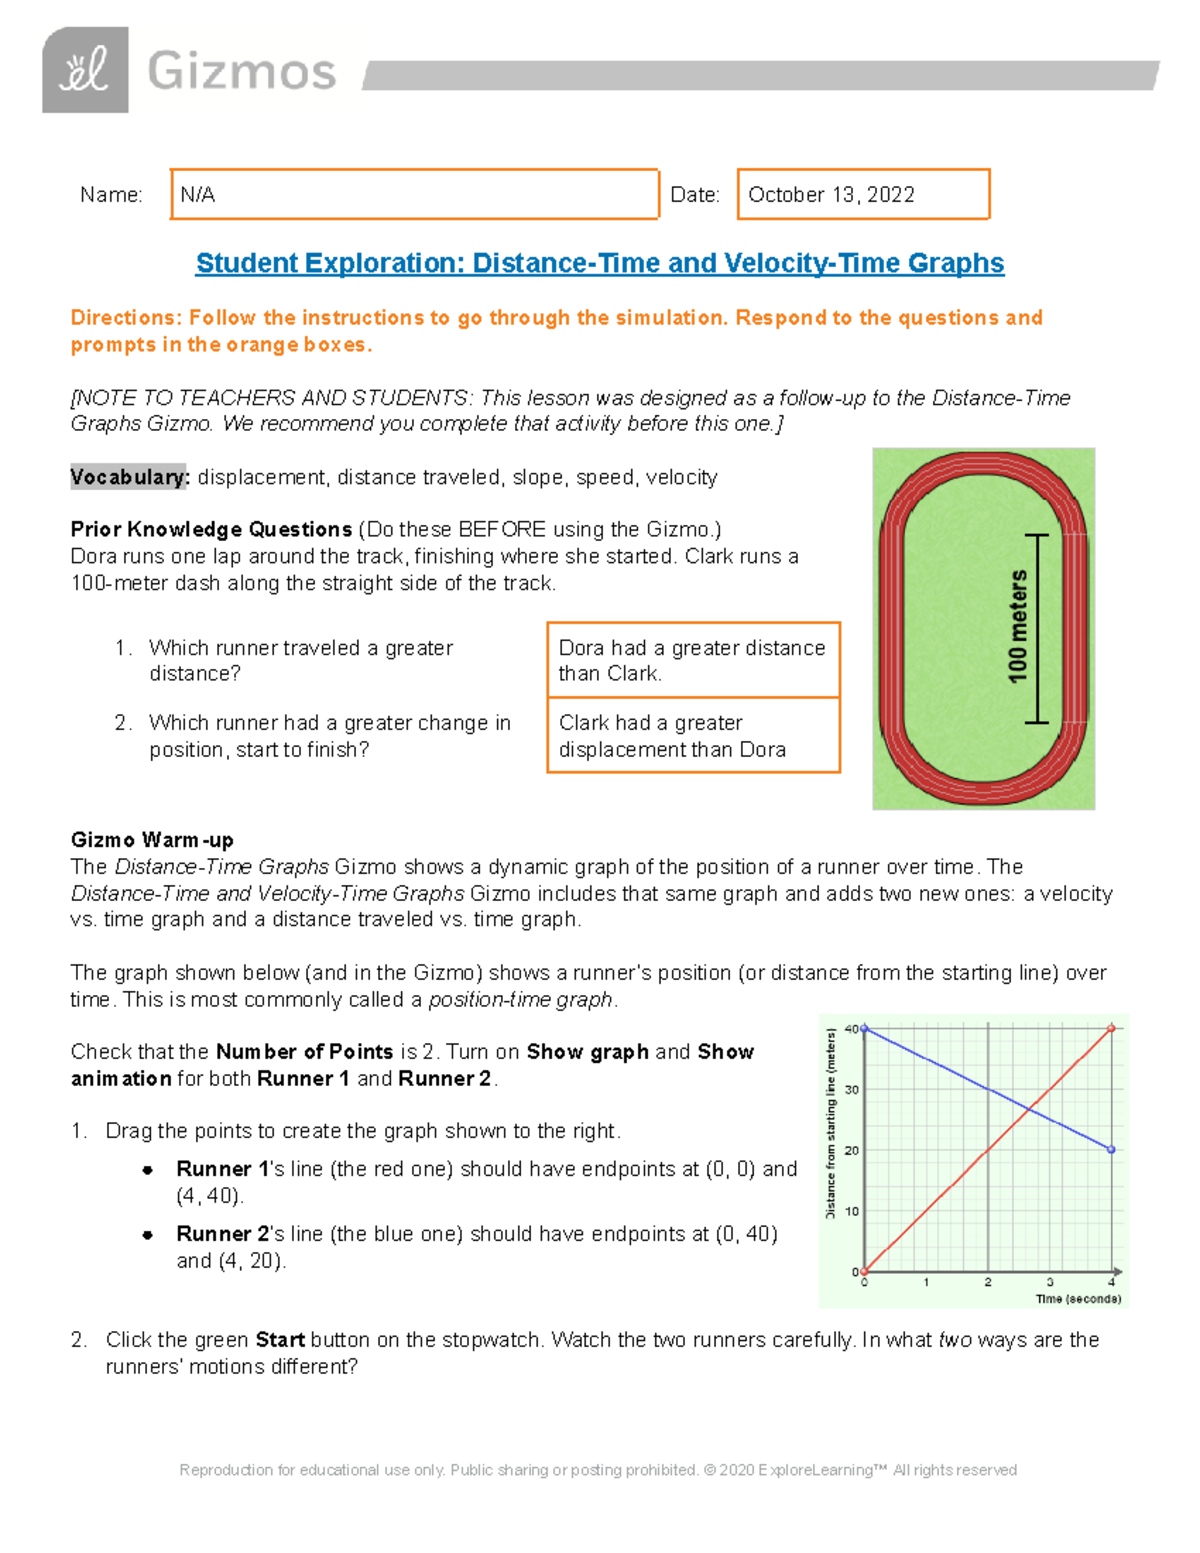
Gizmos Distance-Time Graphs And Velocity-Time Graphs – Deprecated API
www.studocu.com
Graphing Distance Vs Time Worksheet – Printable And Enjoyable Learning

newark2.remotepc.com
Fun Tips About Types Of Distance Time Graph Xy Graphs – Matchhall

matchhall.davidhallyday.net
Speed Time Graphs Worksheet | Fun And Engaging PDF Worksheets

worksheets.clipart-library.com
A14b – Plotting And Interpreting Graphs In Real Contexts To Find

worksheets.clipart-library.com
Worksheet On Distance Time Graph – Worksheets Library

worksheets.clipart-library.com
50 Distance Vs Time Graph Worksheet In 2023 | Graphing Worksheets

www.pinterest.com
The Anatomy Of A Distance – Time Graph

www.pinterest.ca
Distance Vs Time Graph Worksheet Worksheet For Education – Artofit

www.artofit.org
Distance Time Graphs Worksheet | Fun And Engaging PDF Worksheets
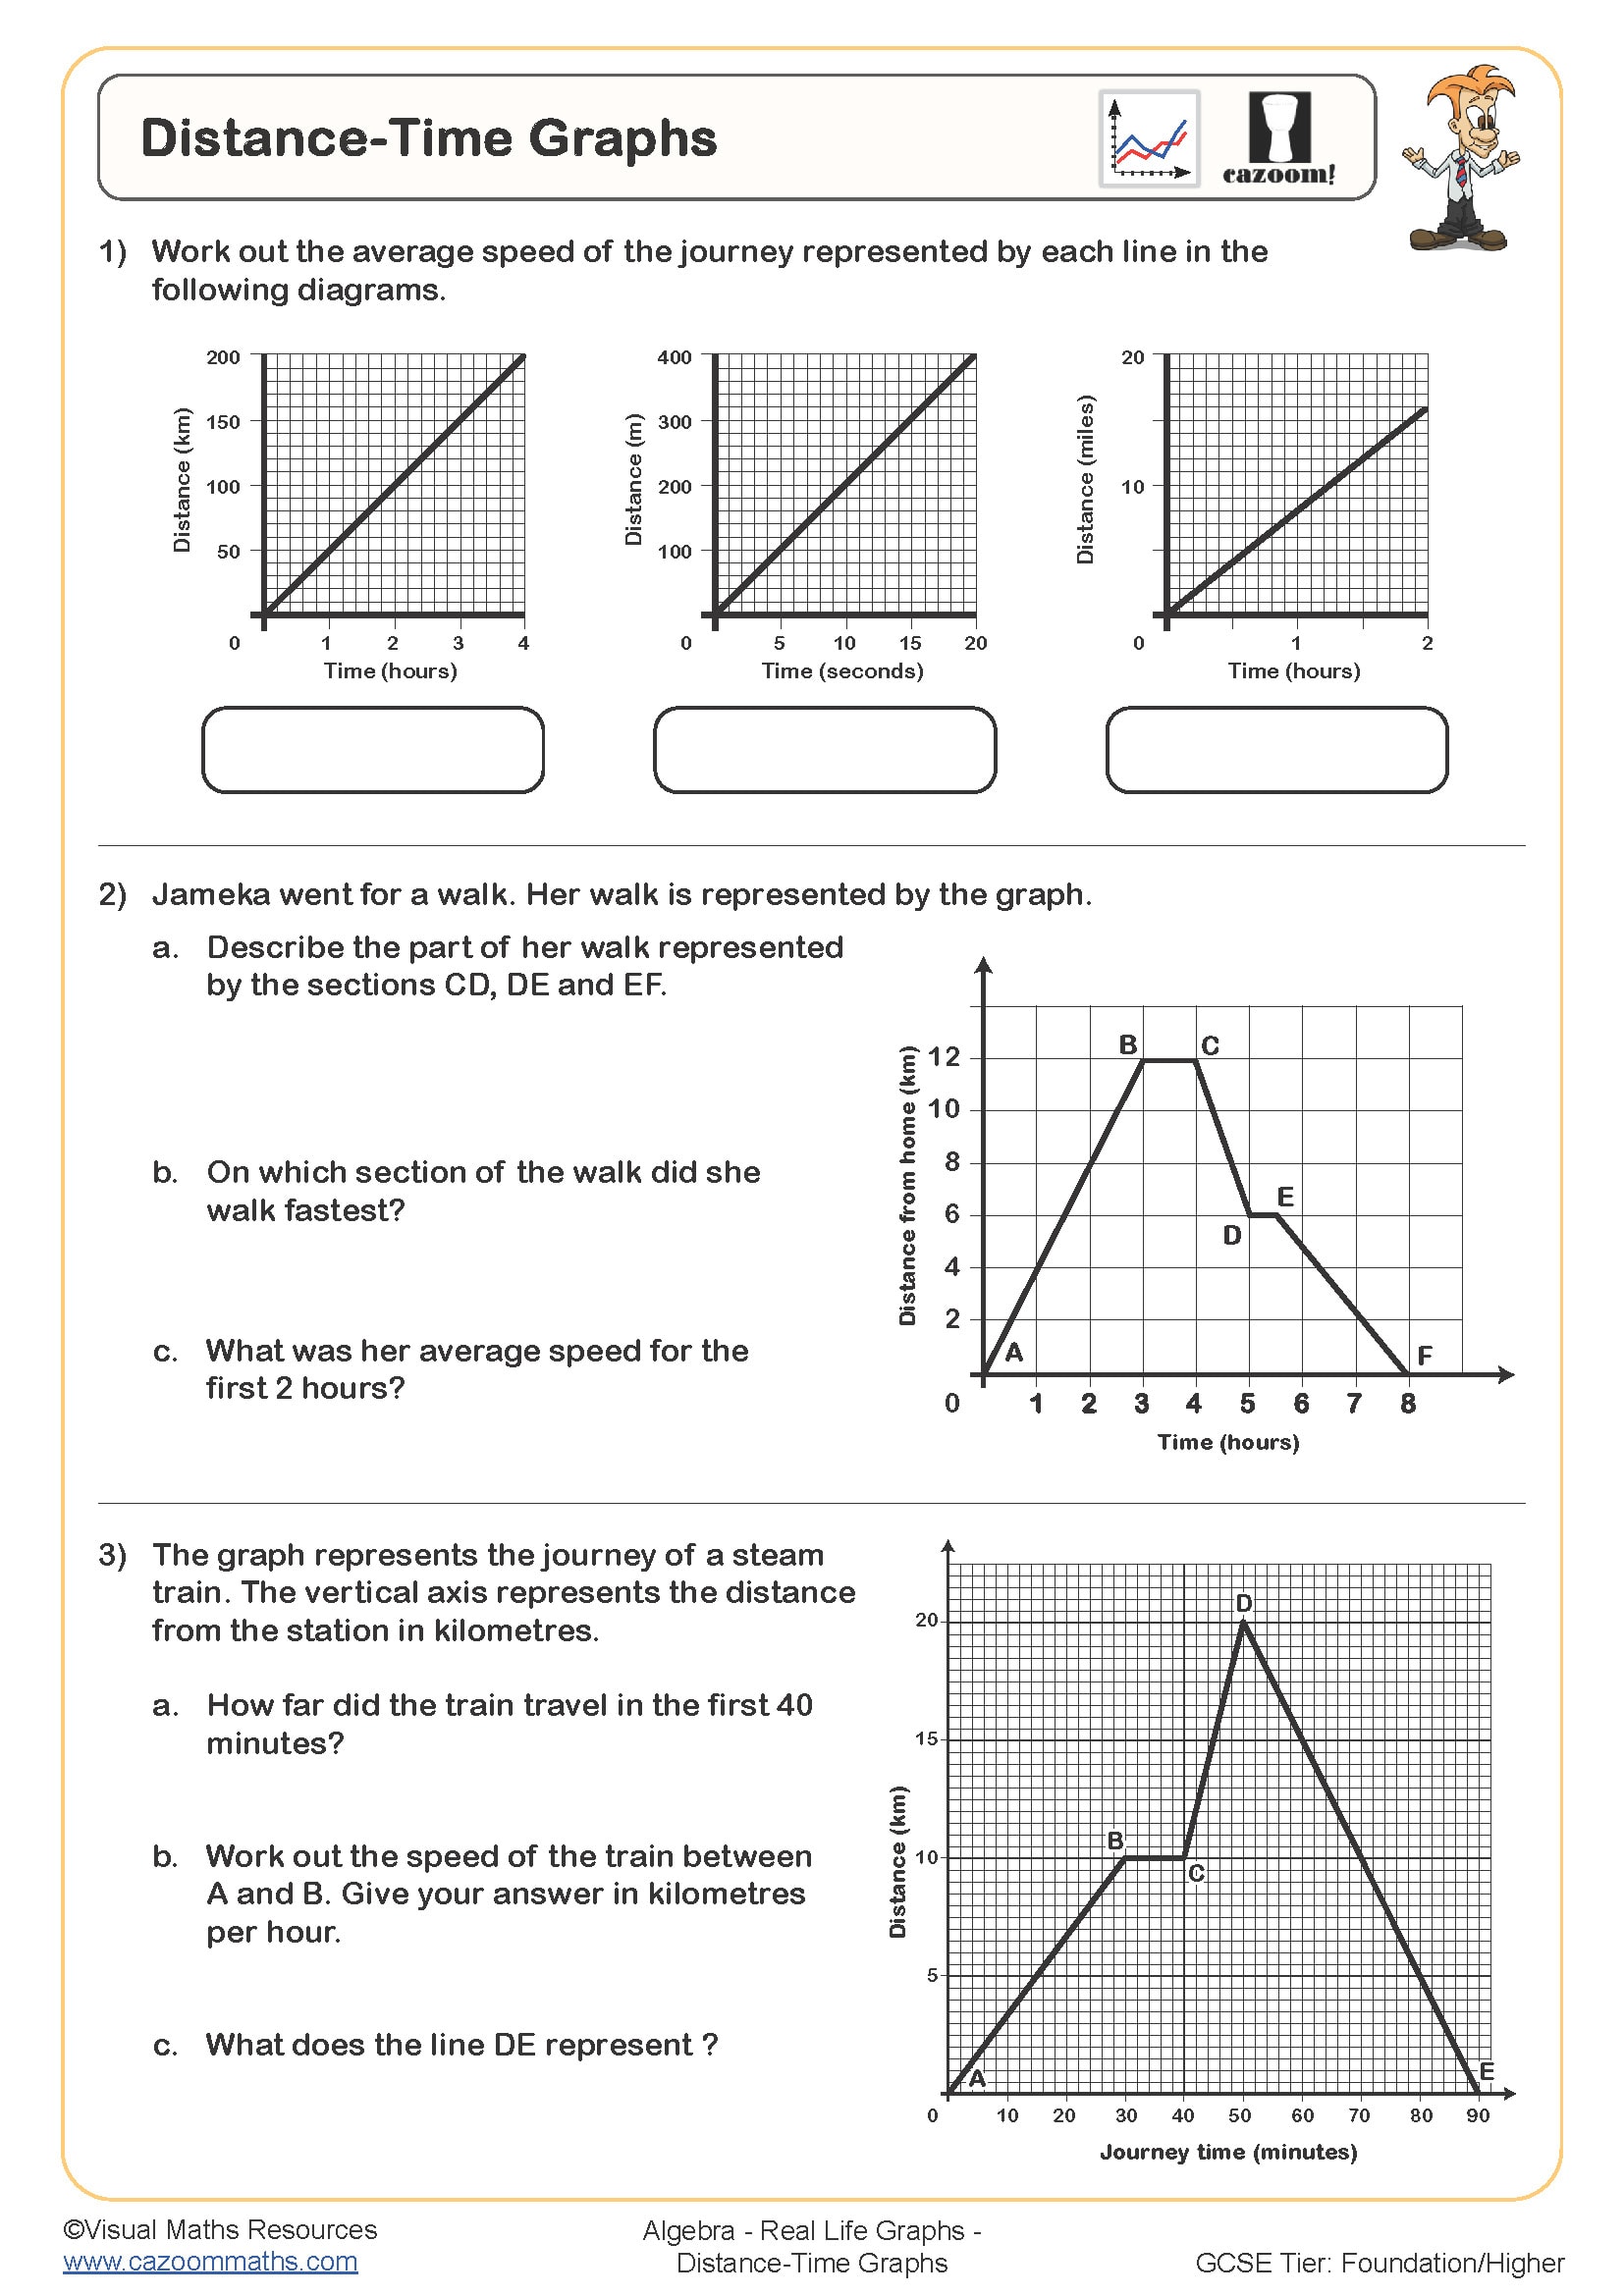
www.cazoommaths.com
Physical Science Distance-time Graphs Worksheet – Scienceworksheets.net
www.scienceworksheets.net
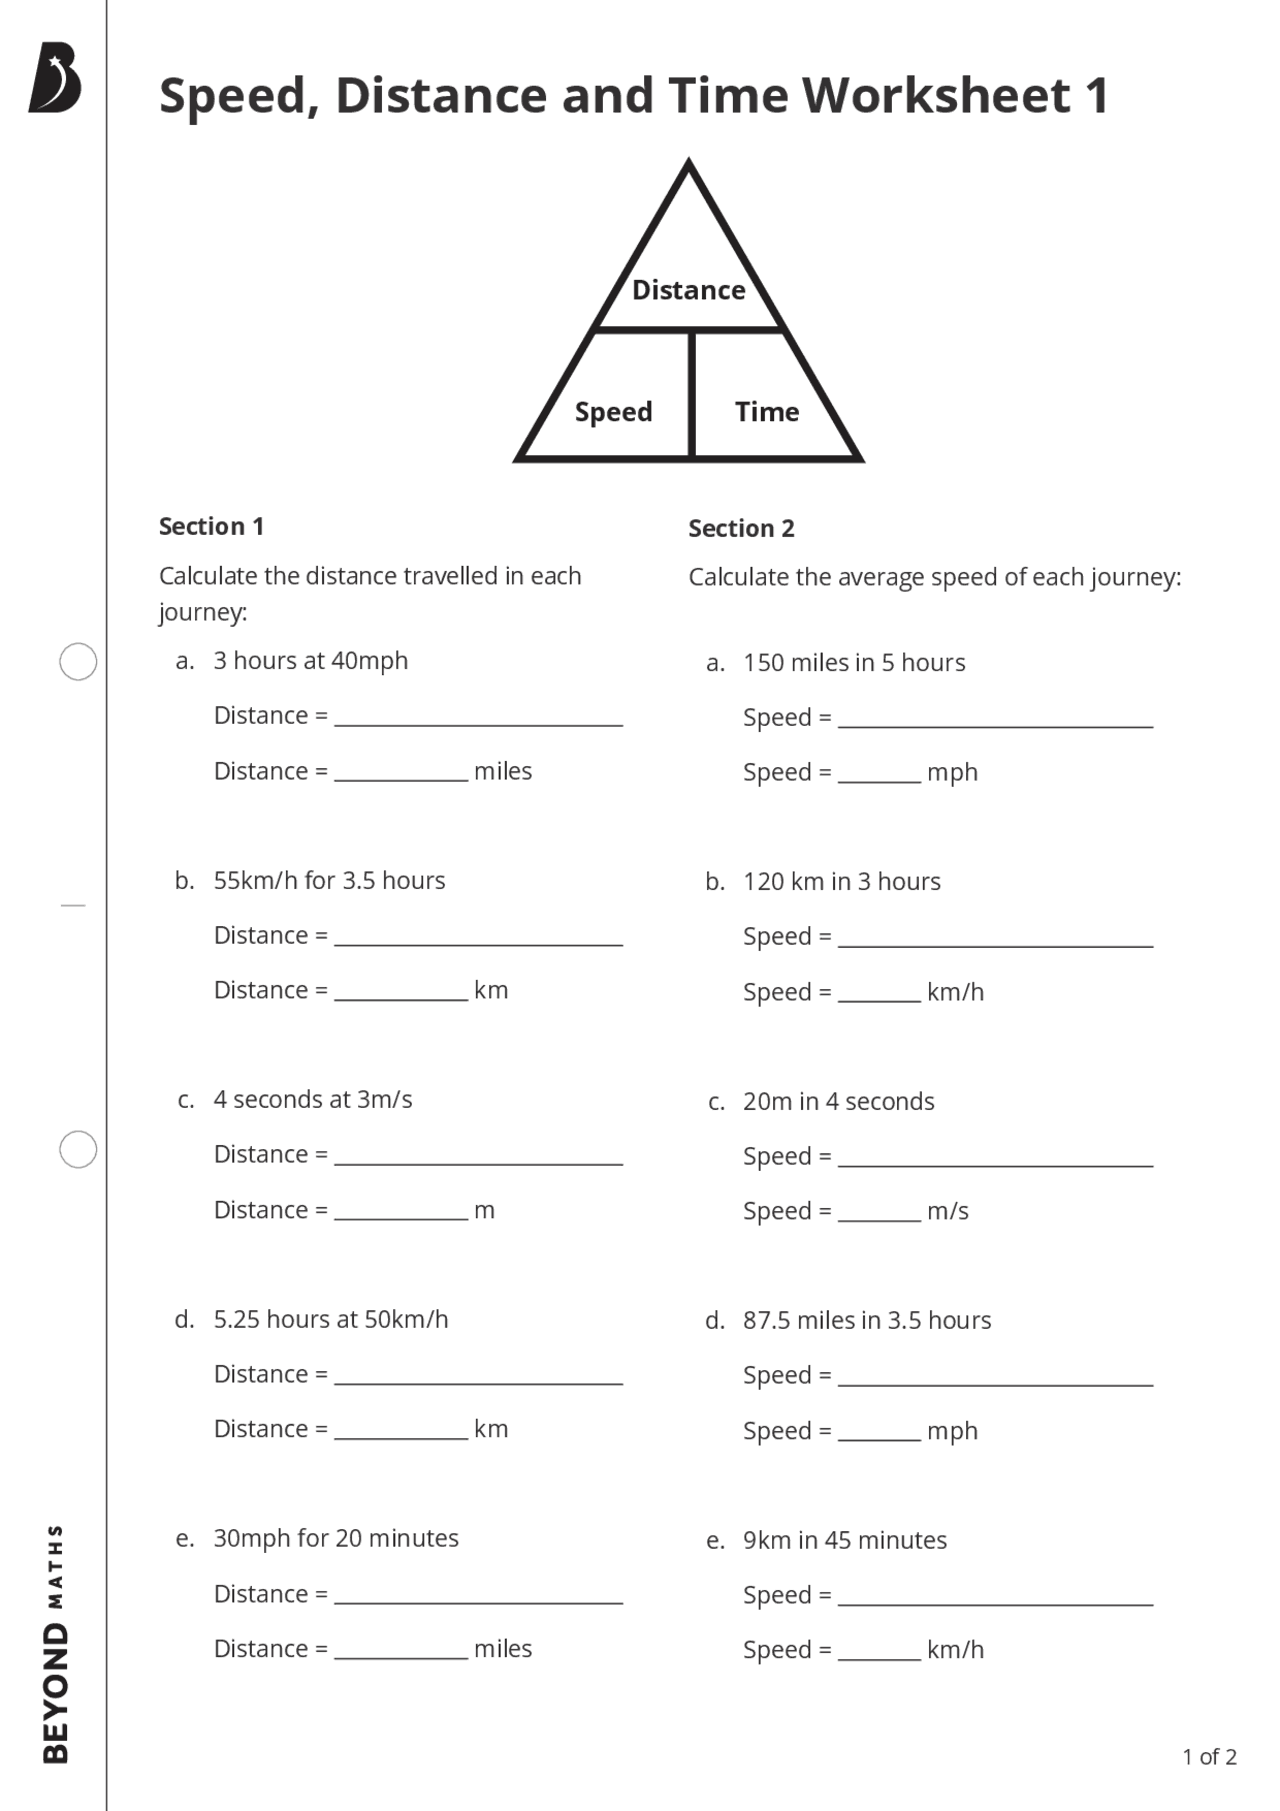
Speed, Distance And Time Worksheet 1, Schemes And Mind Maps
worksheets.clipart-library.com
Gizmos distance-time graphs and velocity-time graphs. distance time graph worksheet with answers. Interpreting distance time graphs worksheet