Embarking on the journey of scientific discovery often begins with a well-designed experiment. The bedrock of any good experiment lies in understanding and meticulously applying the scientific method. This method isn’t just a rigid set of steps; it’s a systematic way of asking questions, formulating hypotheses, testing those hypotheses, and drawing conclusions based on evidence. To master this process, many students and aspiring scientists utilize an experimental design worksheet. This worksheet serves as a structured guide, prompting you to think critically about each element of your experiment, ensuring a robust and reliable outcome. It’s more than just filling in blanks; it’s a tool for fostering scientific rigor and clarity.
Think of the experimental design worksheet as a roadmap. It helps you navigate the often-complex landscape of scientific investigation. Without a map, you might find yourself lost, unsure of your direction, and potentially drawing inaccurate conclusions. The worksheet ensures that your experiments are carefully planned, logically sound, and capable of producing meaningful results. It compels you to identify your variables, control for confounding factors, and define your procedures with precision. By carefully working through each section of the worksheet, you minimize the risk of bias and increase the likelihood of obtaining valid and reproducible findings.
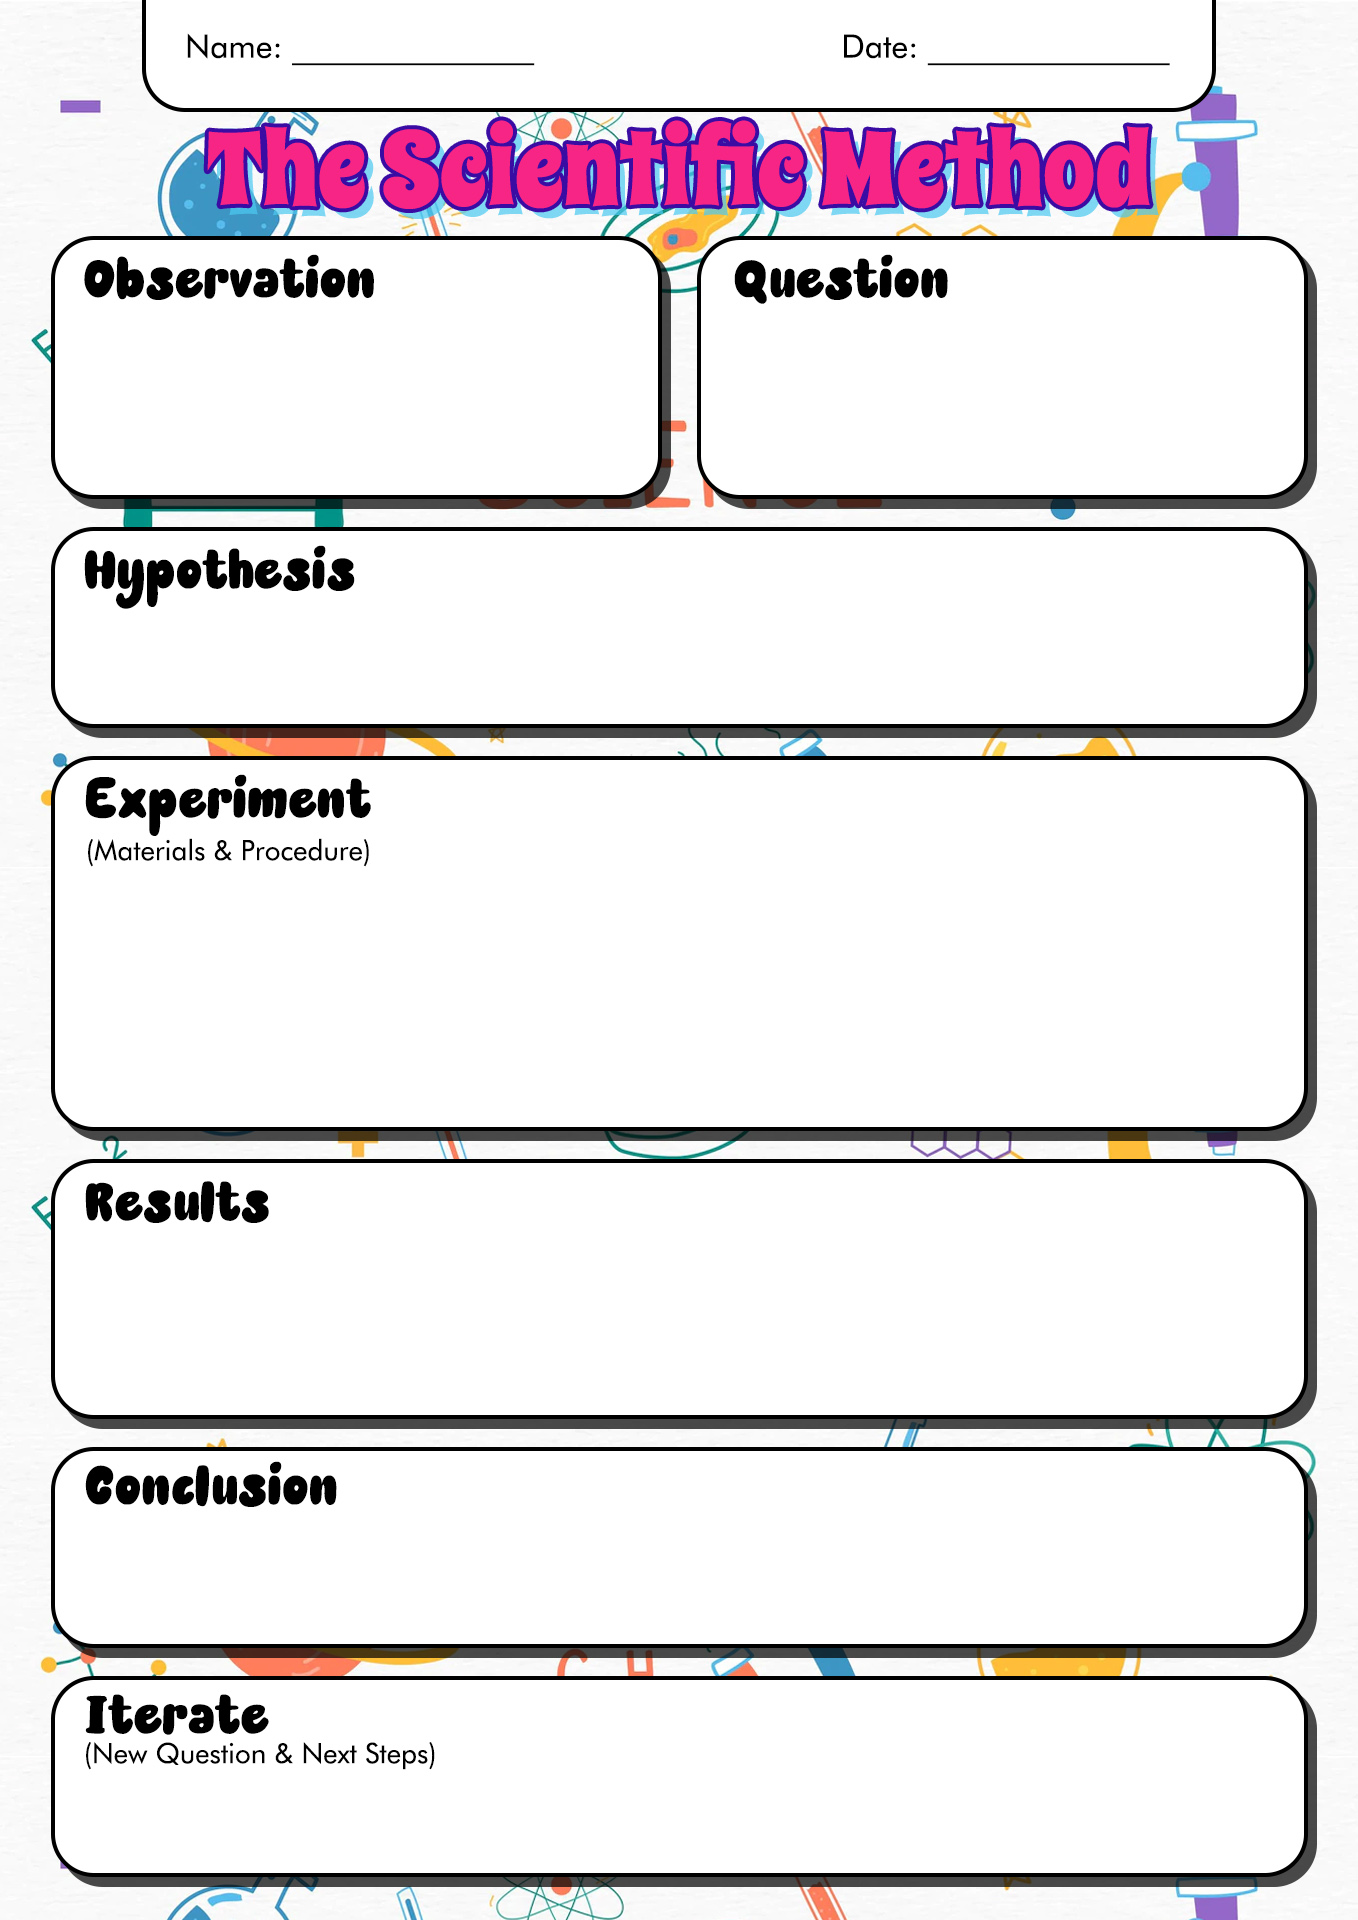
Understanding the Components of an Experimental Design Worksheet
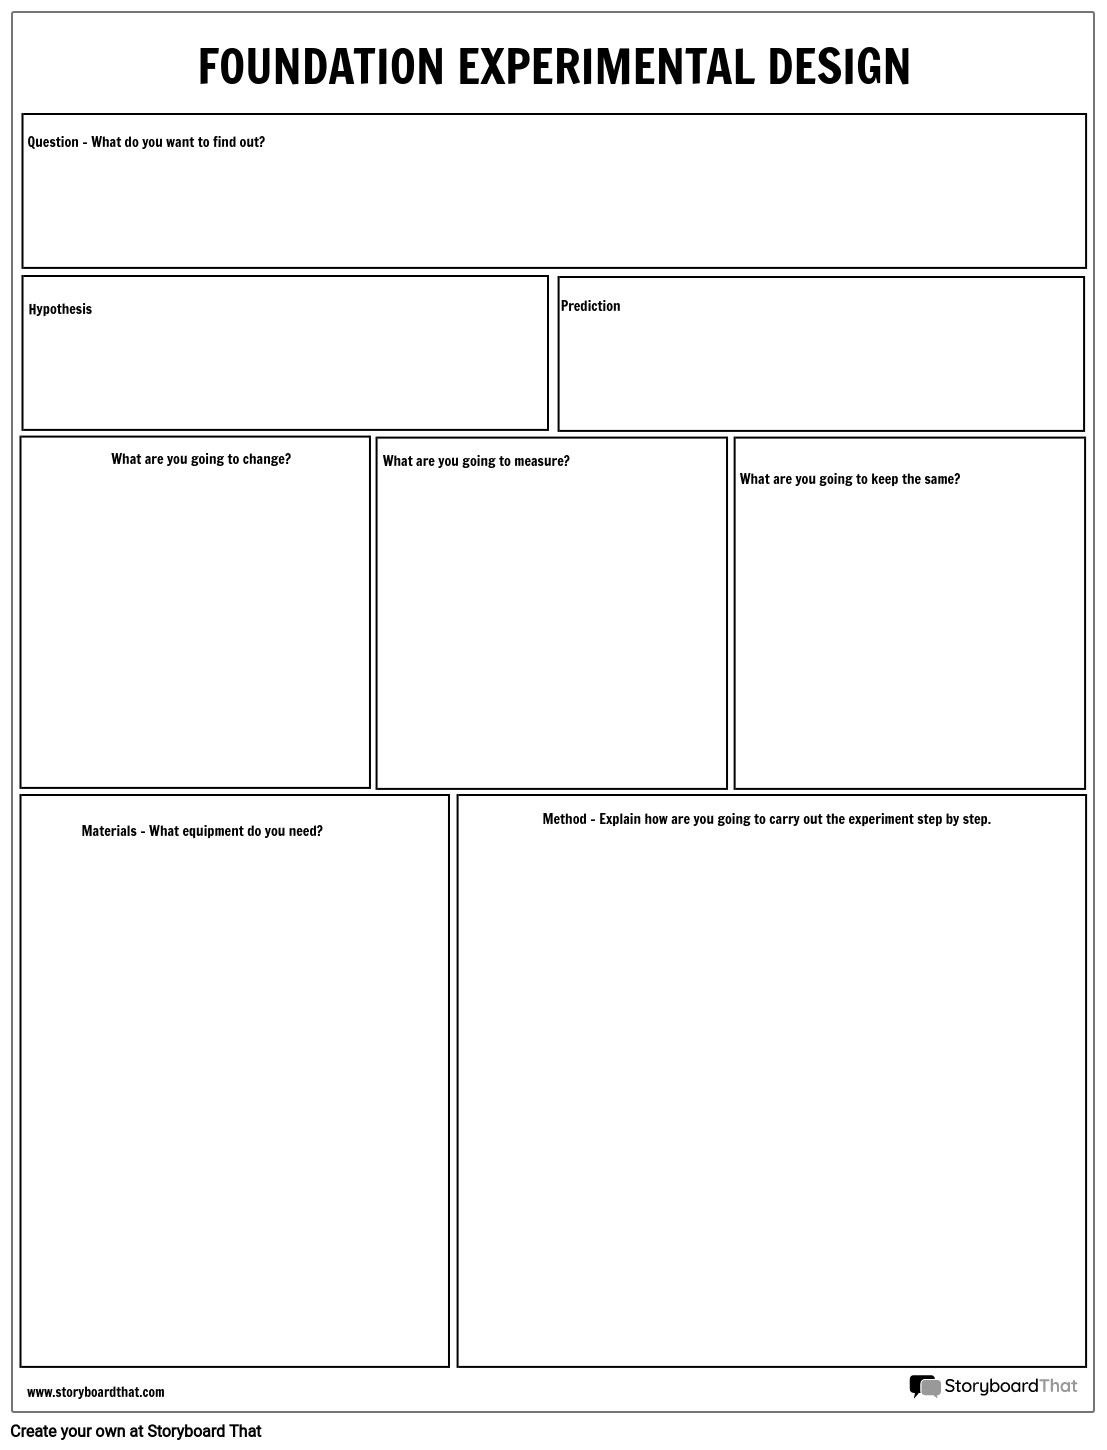
A typical experimental design worksheet will cover several key aspects of the scientific method. Let’s delve into some of the most crucial elements:
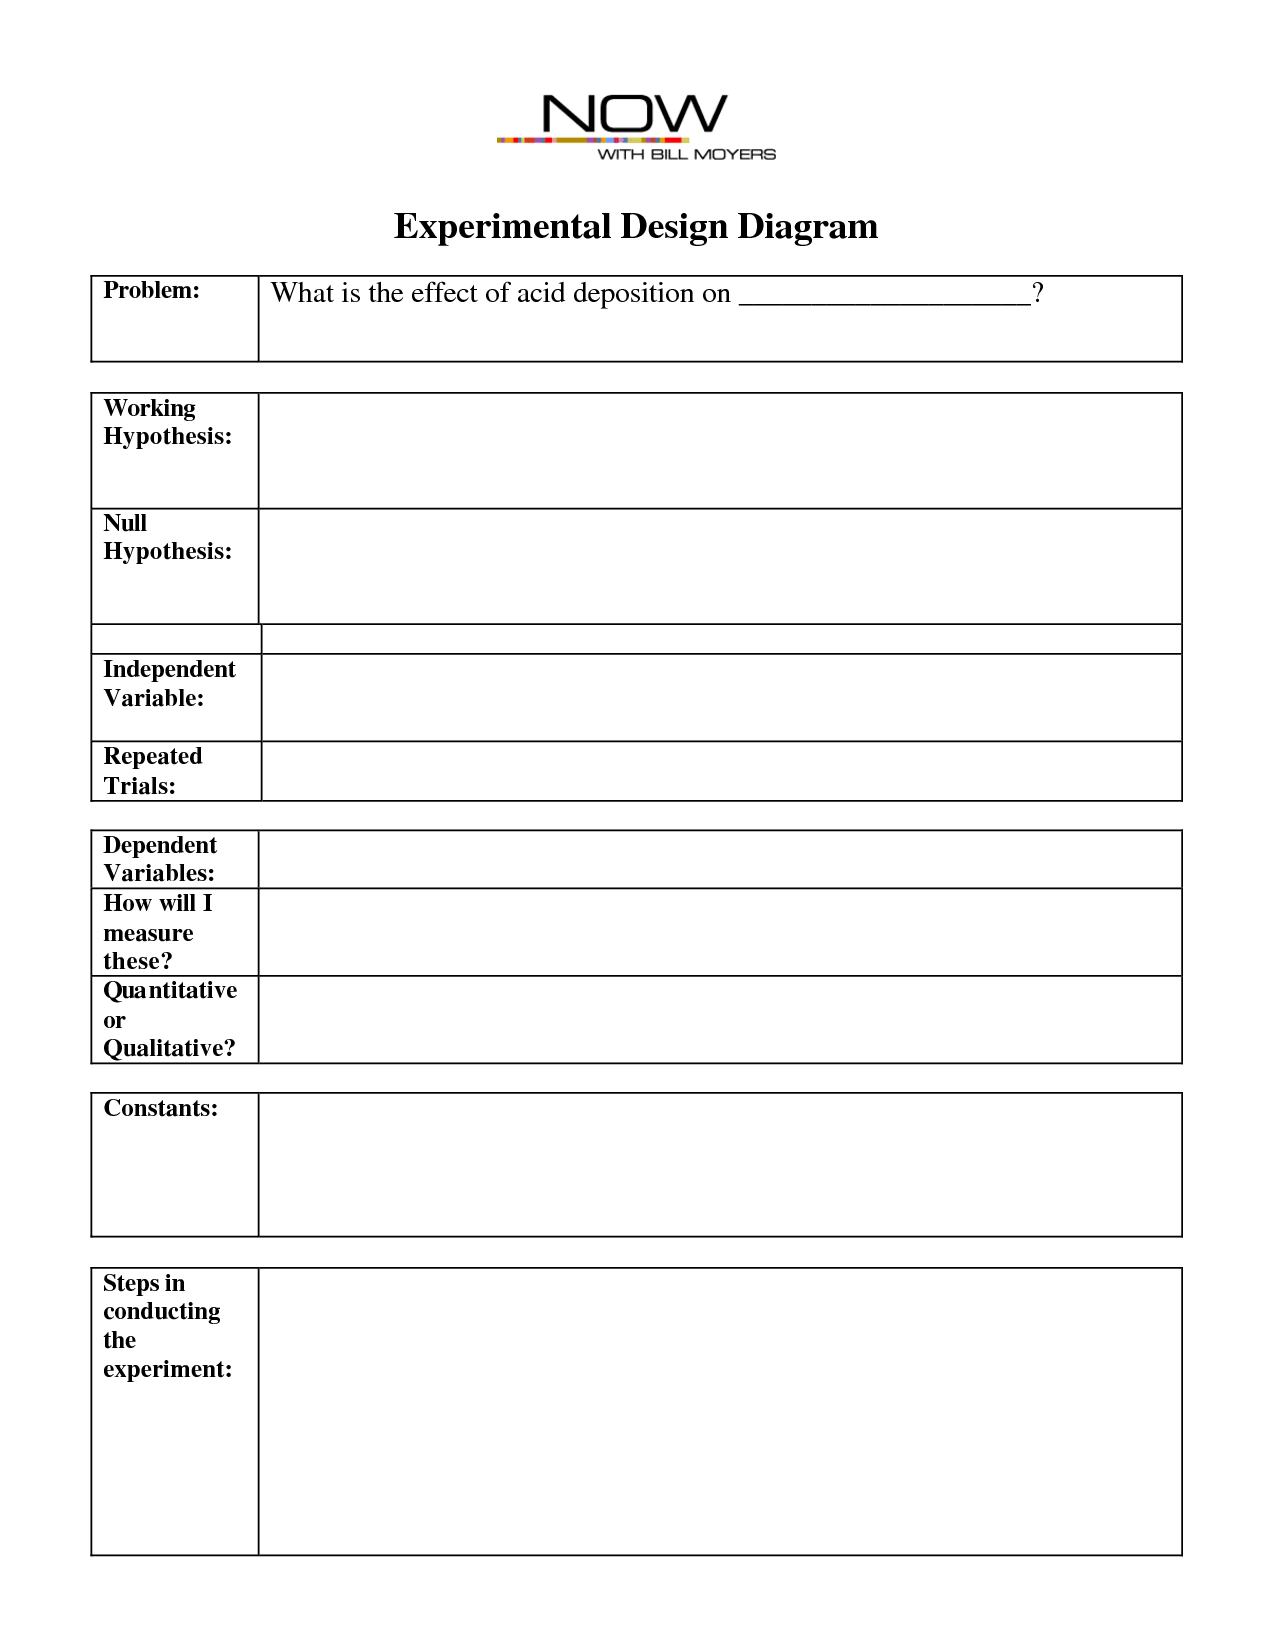
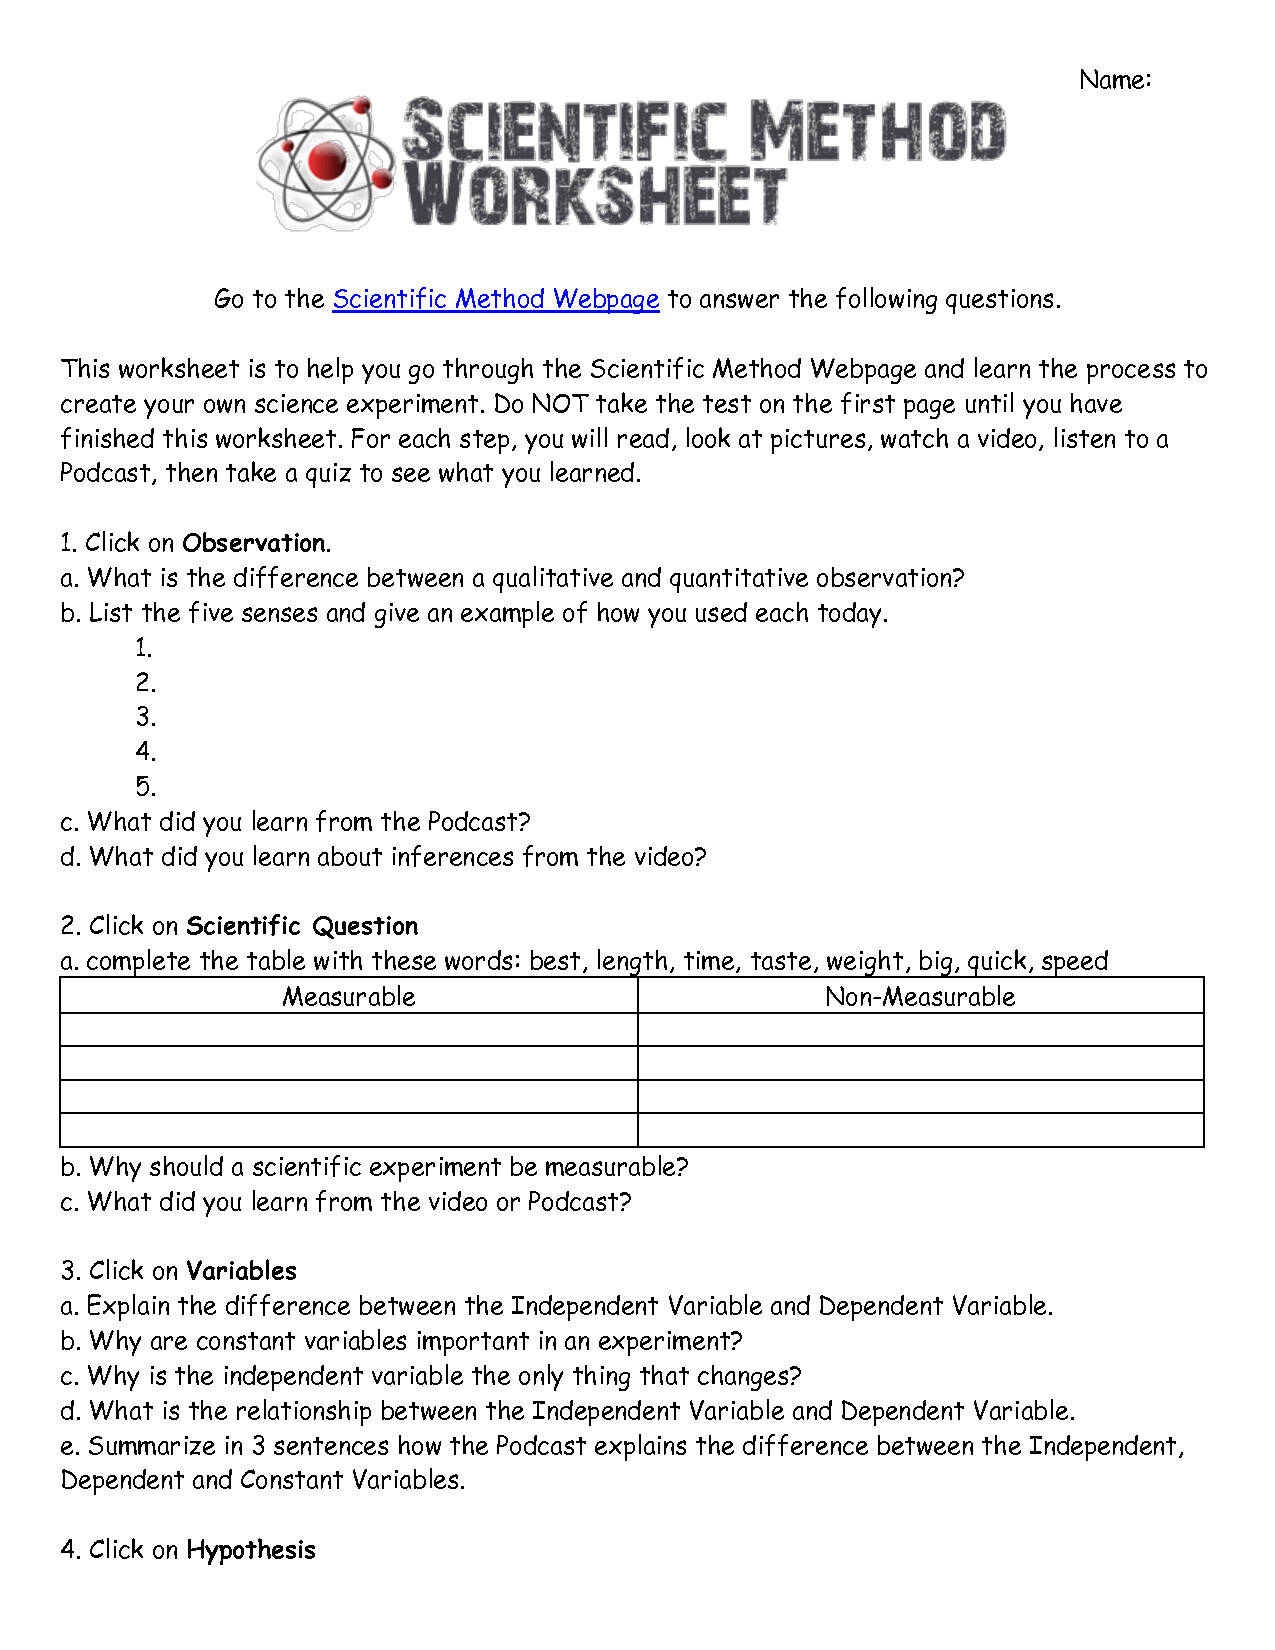
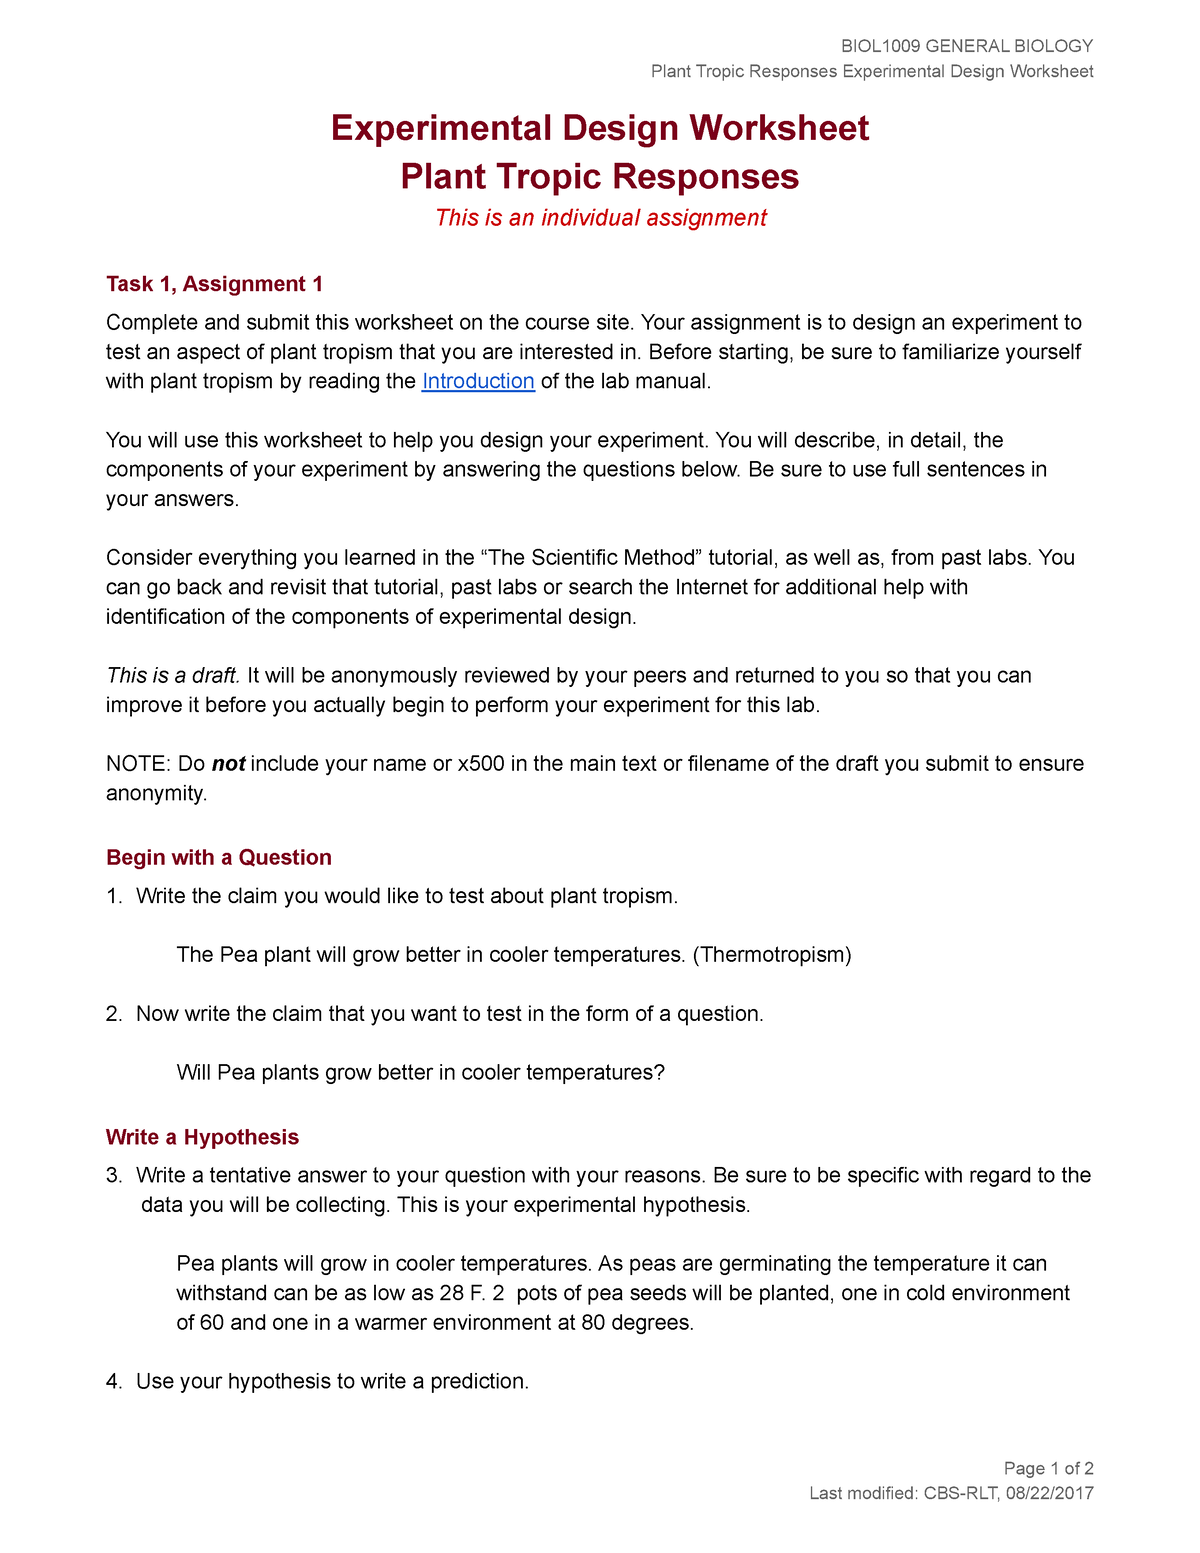
Identifying the Question/Problem
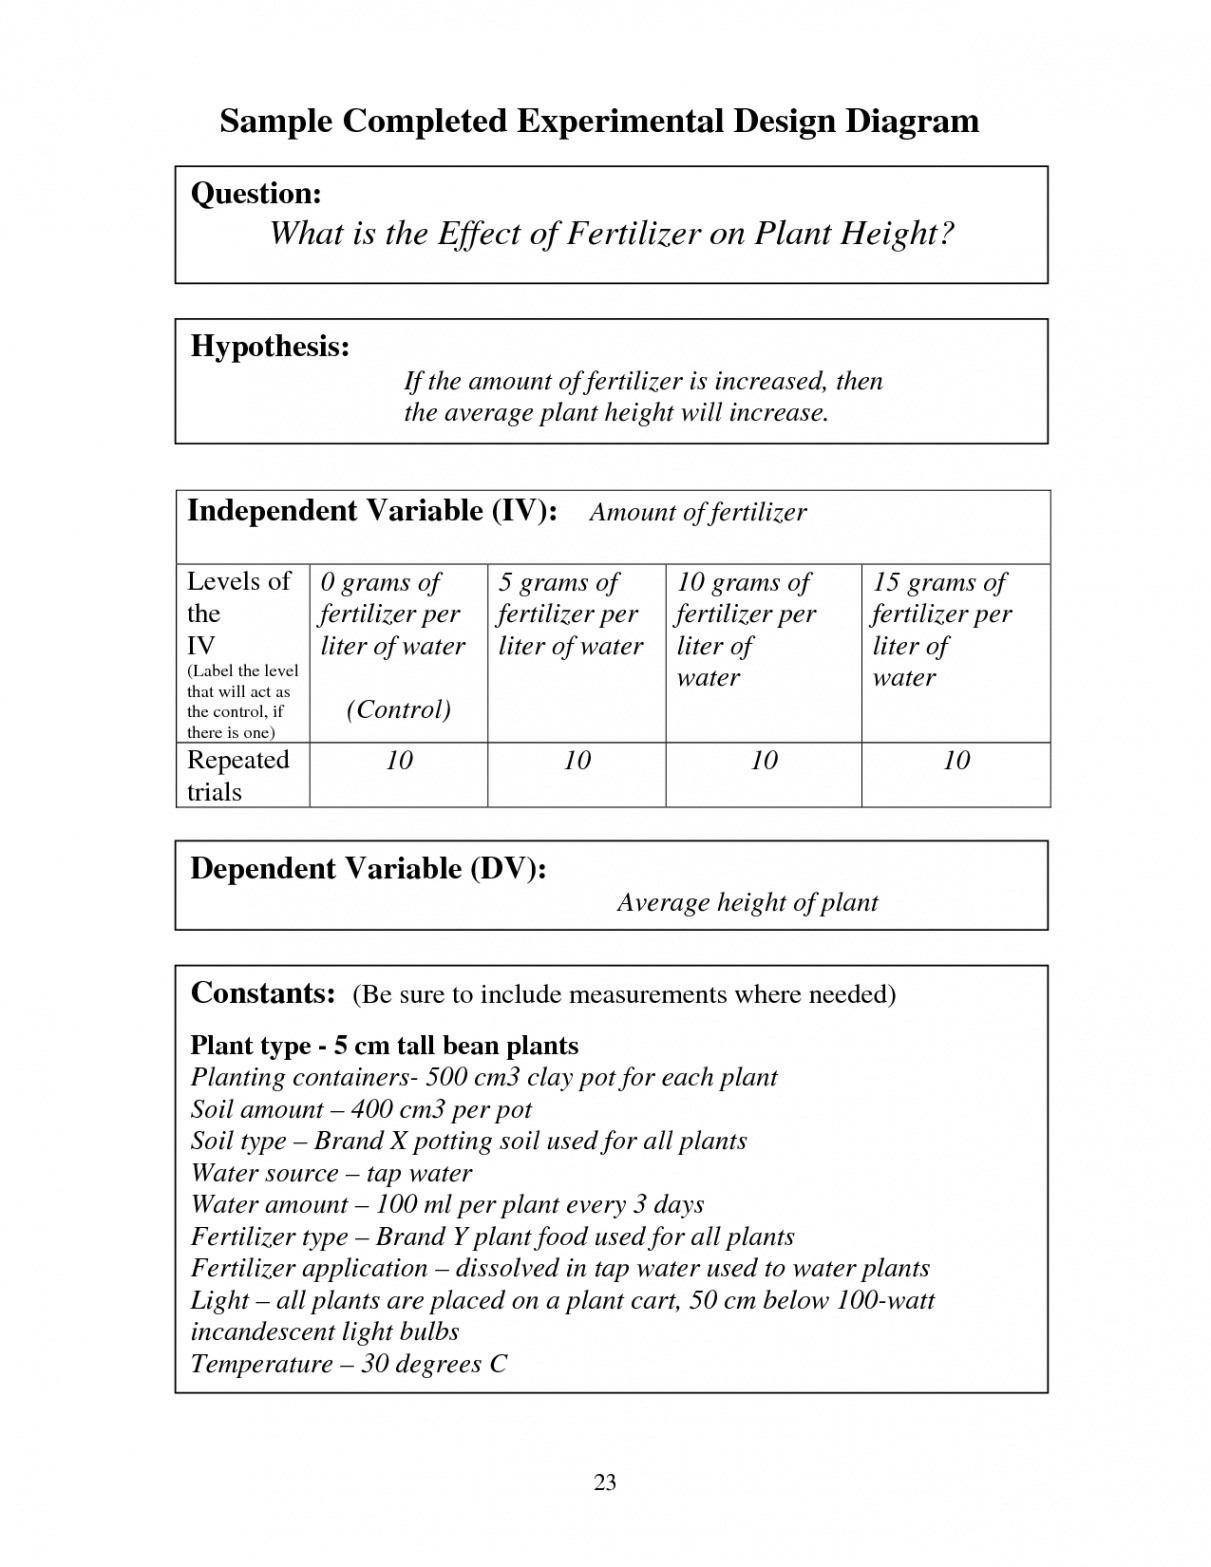
This is where it all starts. What are you trying to find out? The question should be clear, focused, and testable. Avoid broad, vague inquiries and aim for specificity. For example, instead of asking “Does fertilizer affect plant growth?” a more focused question would be, “Does Brand X fertilizer, used in a concentration of 10 ml per liter of water, increase the height of tomato plants compared to plants not fertilized, over a period of 4 weeks?”
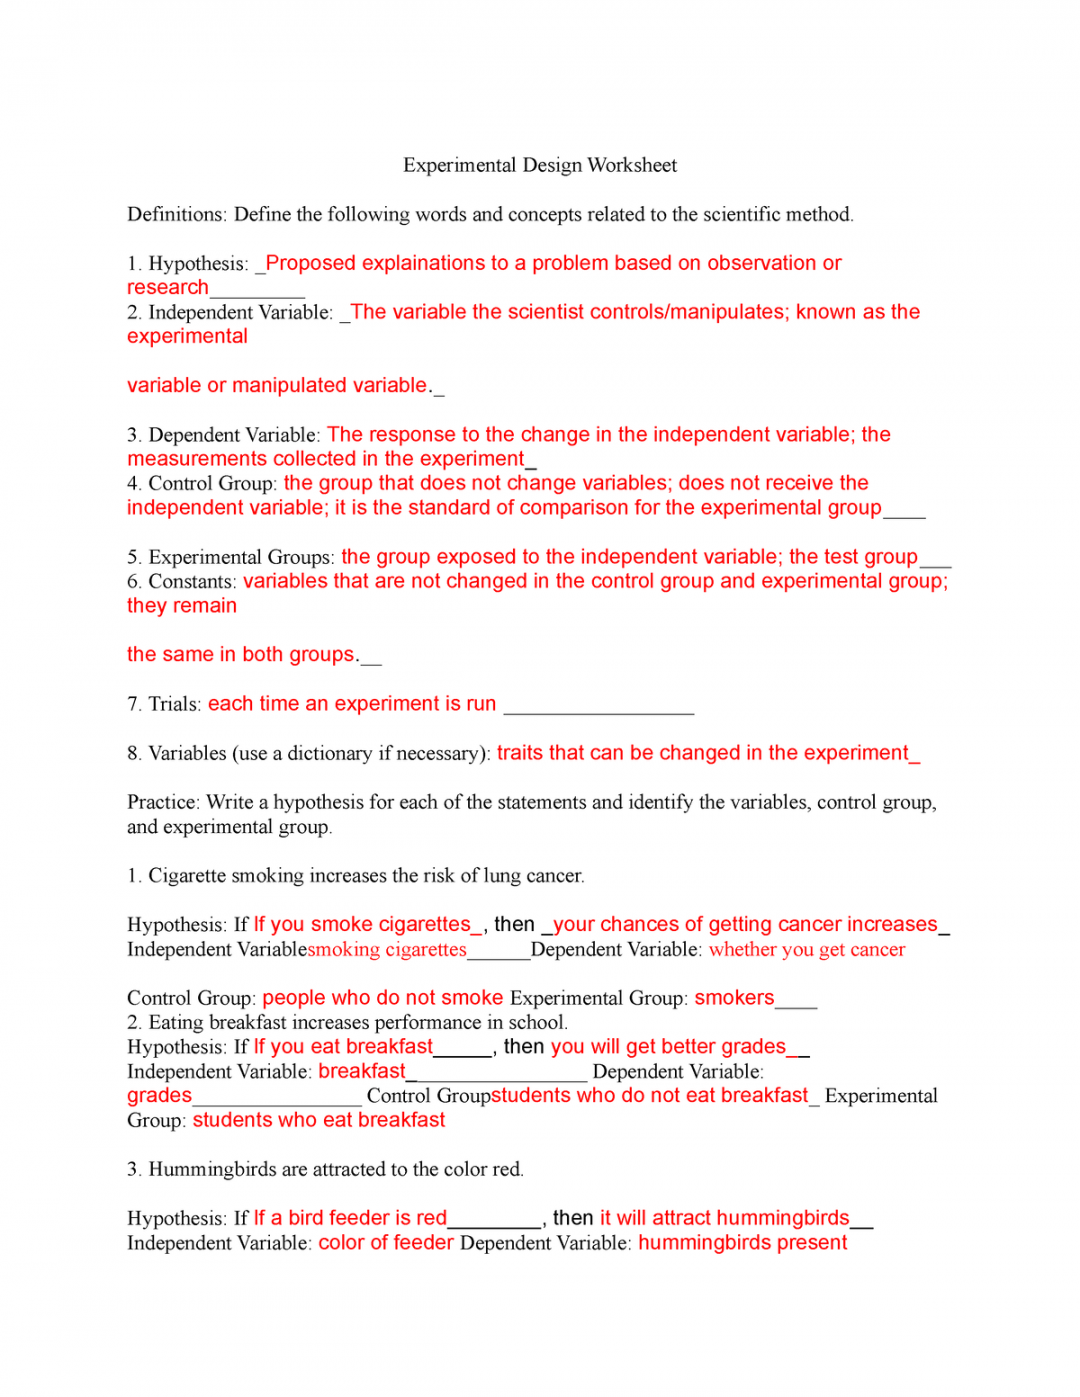
Formulating a Hypothesis
A hypothesis is an educated guess or prediction based on prior knowledge or observations. It’s a tentative explanation for the phenomenon you’re investigating. A good hypothesis is testable and falsifiable, meaning it can be supported or refuted through experimentation. It’s often written in an “If…then…” statement. For example, “If tomato plants are treated with Brand X fertilizer, then their height will increase more than plants not treated with fertilizer.”
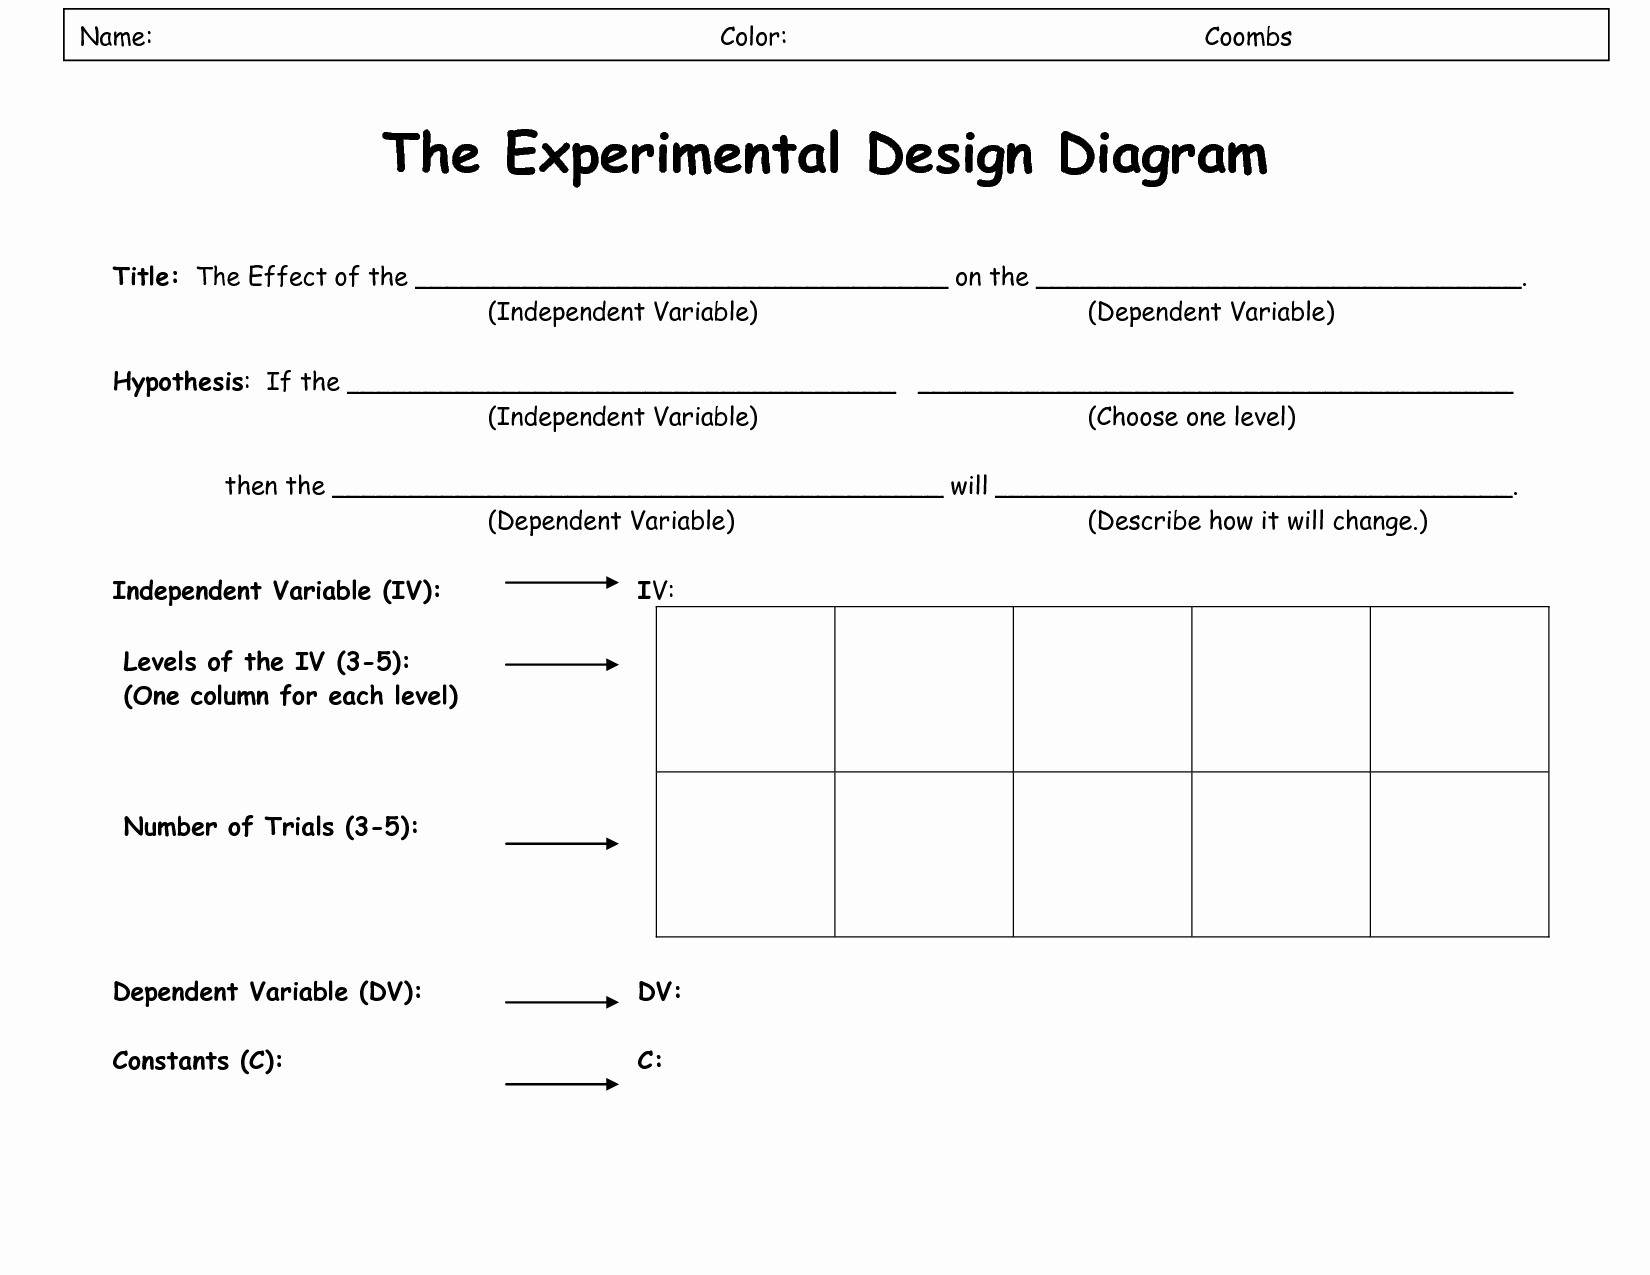
Identifying Variables
Variables are factors that can change or vary in your experiment. You need to identify three key types: the independent variable (the one you manipulate), the dependent variable (the one you measure), and the controlled variables (the ones you keep constant). In the fertilizer example, the independent variable is the presence or absence of Brand X fertilizer, the dependent variable is the height of the tomato plants, and controlled variables might include the type of tomato plant, the amount of sunlight, the amount of water, and the type of soil.
Defining Controls
A control group is a standard of comparison. It’s the group that doesn’t receive the treatment or manipulation being tested. In the fertilizer example, the control group would be the tomato plants that are not treated with Brand X fertilizer. The control group allows you to determine if the changes you observe in the experimental group are actually due to the independent variable or some other factor.
Procedure
The procedure is a detailed, step-by-step description of how you will conduct your experiment. It should be clear and precise enough that someone else could replicate your experiment exactly by following your instructions. Include specific measurements, quantities, and timelines.
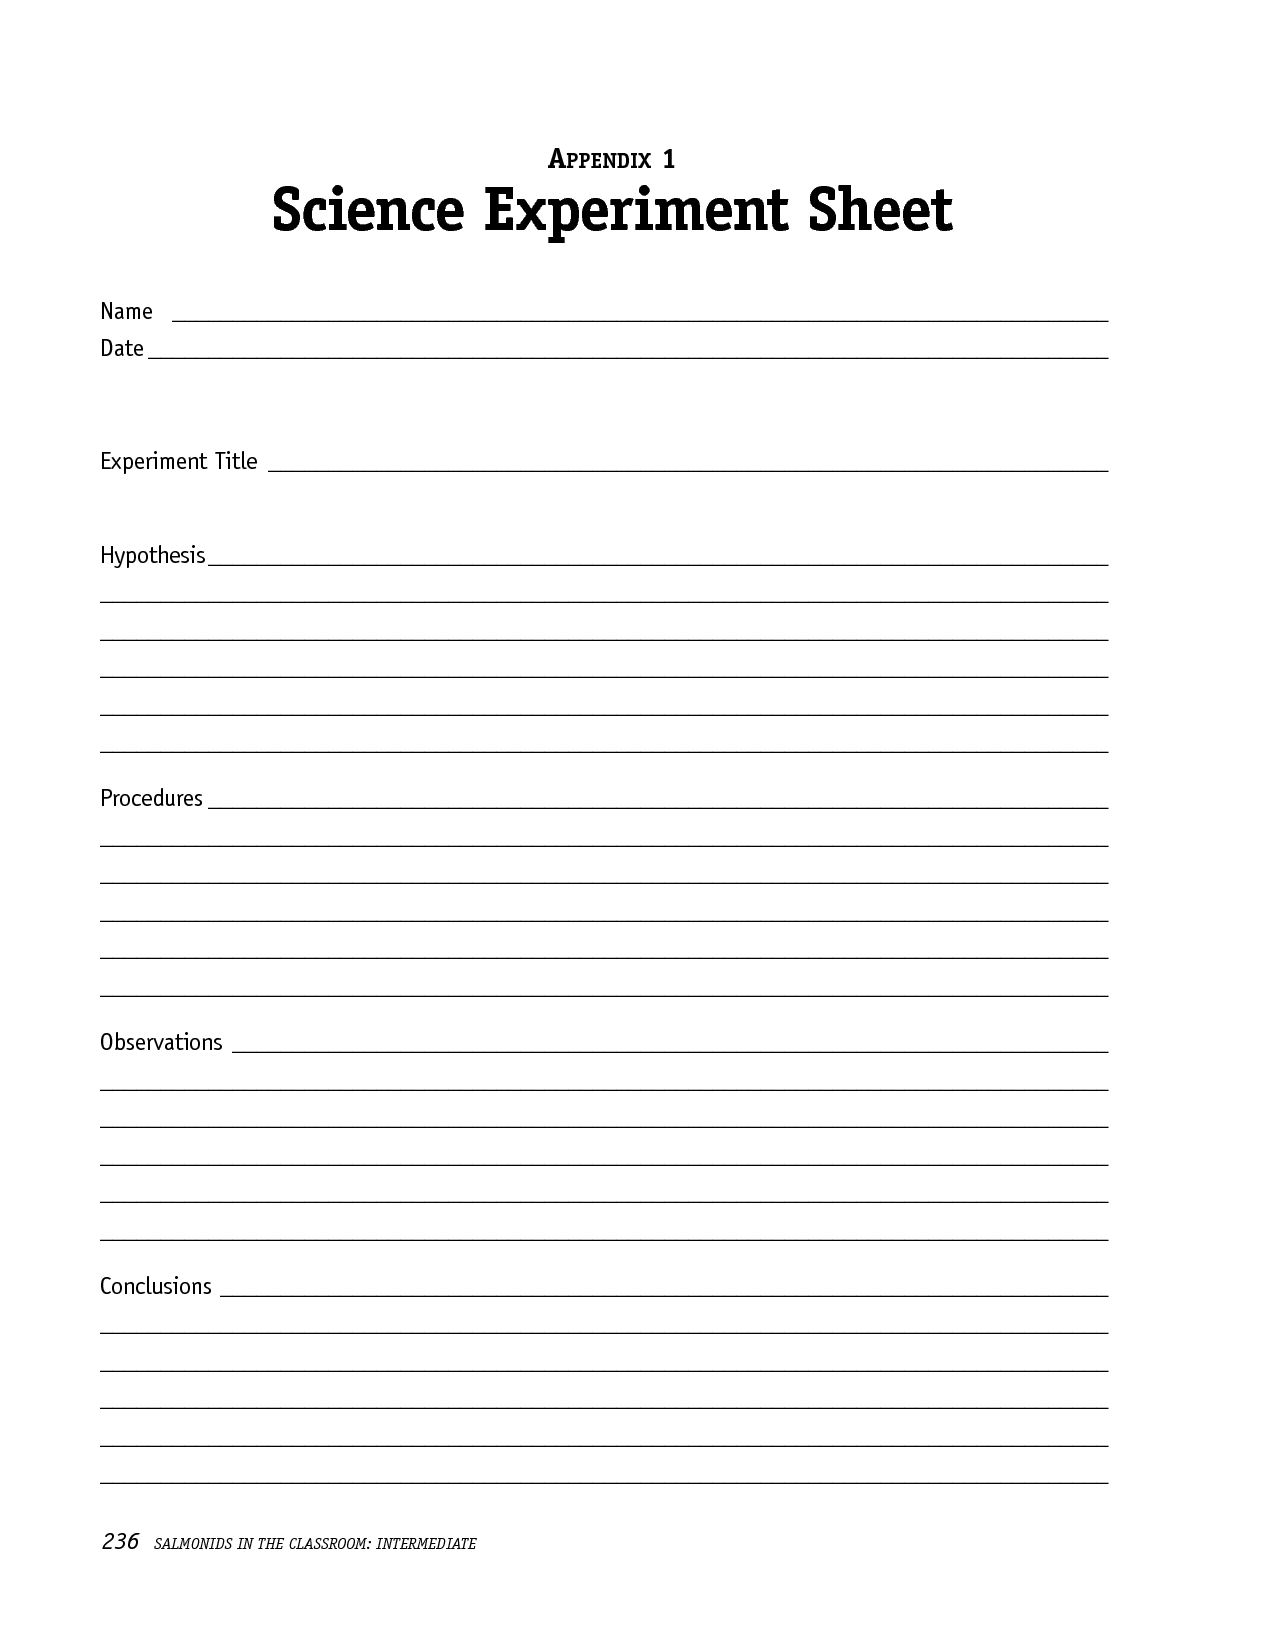
Data Collection and Analysis
This section outlines how you will collect and record your data. This might involve using measuring tools, recording observations, and organizing your data into tables or charts. You also need to specify how you will analyze your data to determine if your results support or refute your hypothesis.
Conclusion
The conclusion is a summary of your findings and an interpretation of your results. Did your data support your hypothesis? What were the limitations of your experiment? What further research could be conducted? Be objective and base your conclusions on the evidence you collected.
By diligently completing an experimental design worksheet, you’re not just going through the motions; you’re engaging in critical thinking, planning strategically, and ensuring that your experiment is scientifically sound. This preparation significantly increases the likelihood of obtaining reliable and meaningful results, contributing to a deeper understanding of the world around us.
Example Answer (in HTML list format)
- Question/Problem: Does the amount of sunlight affect the growth rate of bean plants?
- Hypothesis: If bean plants are exposed to more hours of sunlight per day, then their growth rate will increase.
- Independent Variable: Amount of sunlight (hours per day)
- Dependent Variable: Growth rate of bean plants (cm per day)
-
Controlled Variables:
- Type of bean plant
- Type of soil
- Amount of water
- Temperature
- Size of pot
- Control Group: Bean plants exposed to a standard amount of sunlight (e.g., 6 hours per day).
-
Experimental Group(s):
- Bean plants exposed to 4 hours of sunlight per day
- Bean plants exposed to 8 hours of sunlight per day
- Bean plants exposed to 10 hours of sunlight per day
-
Procedure:
- Obtain 30 bean plants of the same variety and size.
- Plant each bean plant in an individual pot filled with the same type of soil.
- Divide the plants into four groups: Control (6 hours of sunlight), Group A (4 hours of sunlight), Group B (8 hours of sunlight), Group C (10 hours of sunlight).
- Place each group in a designated area with the appropriate amount of sunlight exposure (using artificial lighting if necessary to supplement natural sunlight).
- Water each plant with the same amount of water (e.g., 50 ml) every day.
- Measure the height of each plant every day for two weeks.
- Record the data in a table.
-
Data Collection and Analysis:
- Measure and record the height of each plant daily in centimeters.
- Calculate the average growth rate (cm per day) for each group of plants.
- Create a graph showing the relationship between the amount of sunlight and the growth rate of bean plants.
- Use a statistical test (e.g., ANOVA) to determine if there is a significant difference in growth rates between the different groups.
- Conclusion: Based on the data collected, determine whether the hypothesis was supported or refuted. Discuss any limitations of the experiment and suggest future research directions (e.g., investigate the effect of different wavelengths of light on plant growth).
If you are looking for Scientific Method Worksheet & Example for Kids – STEM Smartly you’ve came to the right web. We have 20 Pics about Scientific Method Worksheet & Example for Kids – STEM Smartly like Worksheet for Using Scientific Method to Study Plants, Experimental Design Worksheet Scientific Method and also Experimental Design Worksheet Scientific Method Answers Worksheet. Here you go:
Scientific Method Worksheet & Example For Kids – STEM Smartly

worksheets.clipart-library.com
Experimental Design Worksheet Scientific Method – Free Worksheets Printable
lisaworksheets.com
The Scientific Method Facts, Worksheets, Types & Characteristics

worksheets.clipart-library.com
Experimental Design Worksheet Answers – Printable Calendars AT A GLANCE

ataglance.randstad.com
Worksheet For Using Scientific Method To Study Plants

www.pinterest.com
Scientific Method Coloring Sheet – Worksheets Library

worksheets.clipart-library.com
Experimental Design Practice Worksheet Answers – Printable PDF Template
martinlindelof.com
Experimental Design Worksheet Scientific Method Unique 4 Best Of
chessmuseum.org
Experimental Design Worksheet Scientific Method Answers Worksheet

www.thesecularparent.com
Experimental Design Worksheet
sahklubrad.com
Experimental Design Worksheet Scientific Method – Pro Worksheet
www.proworksheet.my.id
Experimental Design Worksheet Scientific Method
www.proworksheet.my.id
Experimental Design Worksheet Template – Google Search – Worksheets
worksheets.clipart-library.com
Experimental Design Worksheet Scientific Method

www.proworksheet.my.id
? Scientific Method For Kids (with Free Printables!) – Worksheets Library

worksheets.clipart-library.com
Experimental Design Worksheets Scientific Method
learningschoolwesleyan.z21.web.core.windows.net
Experimental Design Worksheet 3

learningschoolcouleemg.z4.web.core.windows.net
Scientific Method Worksheet High School – Owhentheyanks.com
www.owhentheyanks.com
Experimental Design Worksheet Scientific Method – E-streetlight.com

www.e-streetlight.com
18 Scientific Method Worksheet PDF – Free PDF At Worksheeto.com
www.worksheeto.com
experimental design worksheet scientific method. Experimental design worksheet. experimental design worksheet scientific method