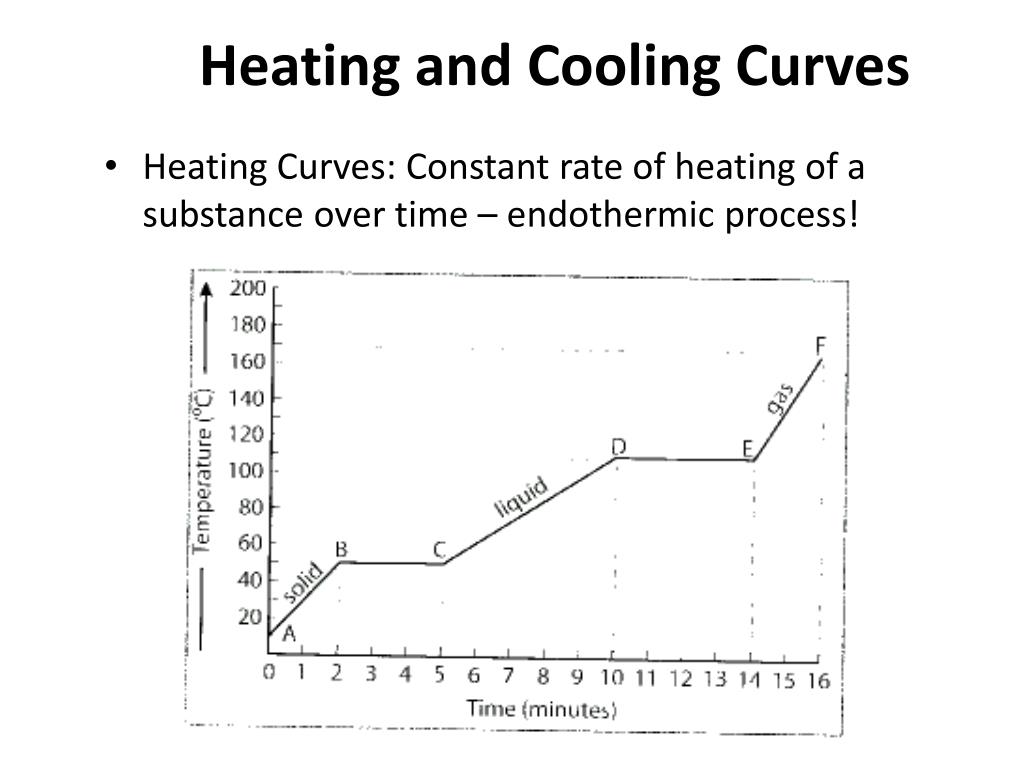
Understanding the states of matter and the transitions between them is a fundamental concept in science. One of the best ways to visualize and analyze these transitions is through the use of heating and cooling curves. These curves graphically represent how the temperature of a substance changes as heat is either added (heating curve) or removed (cooling curve) over time. A Heating And Cooling Curves Worksheet can be an invaluable tool for students learning about phase changes, specific heat capacity, latent heat, and the energy involved in altering the state of a substance.
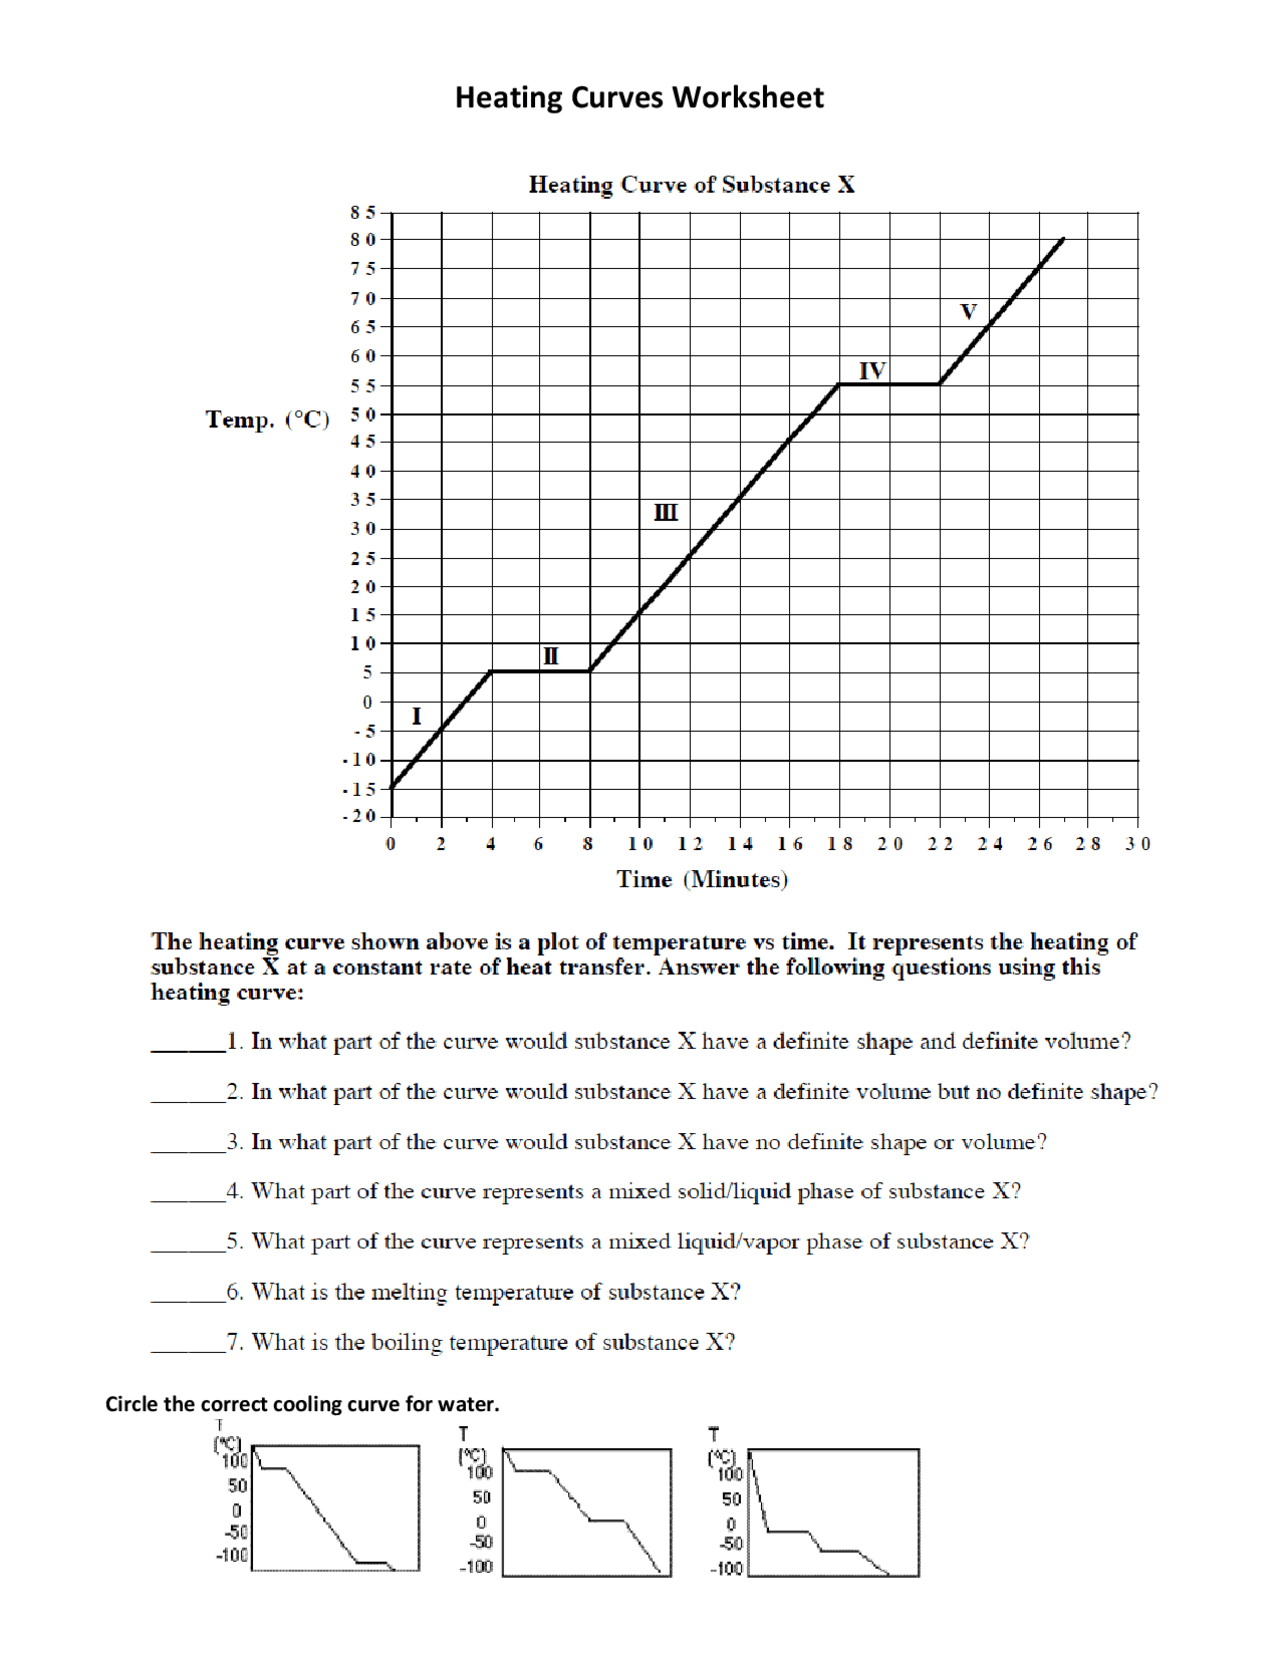
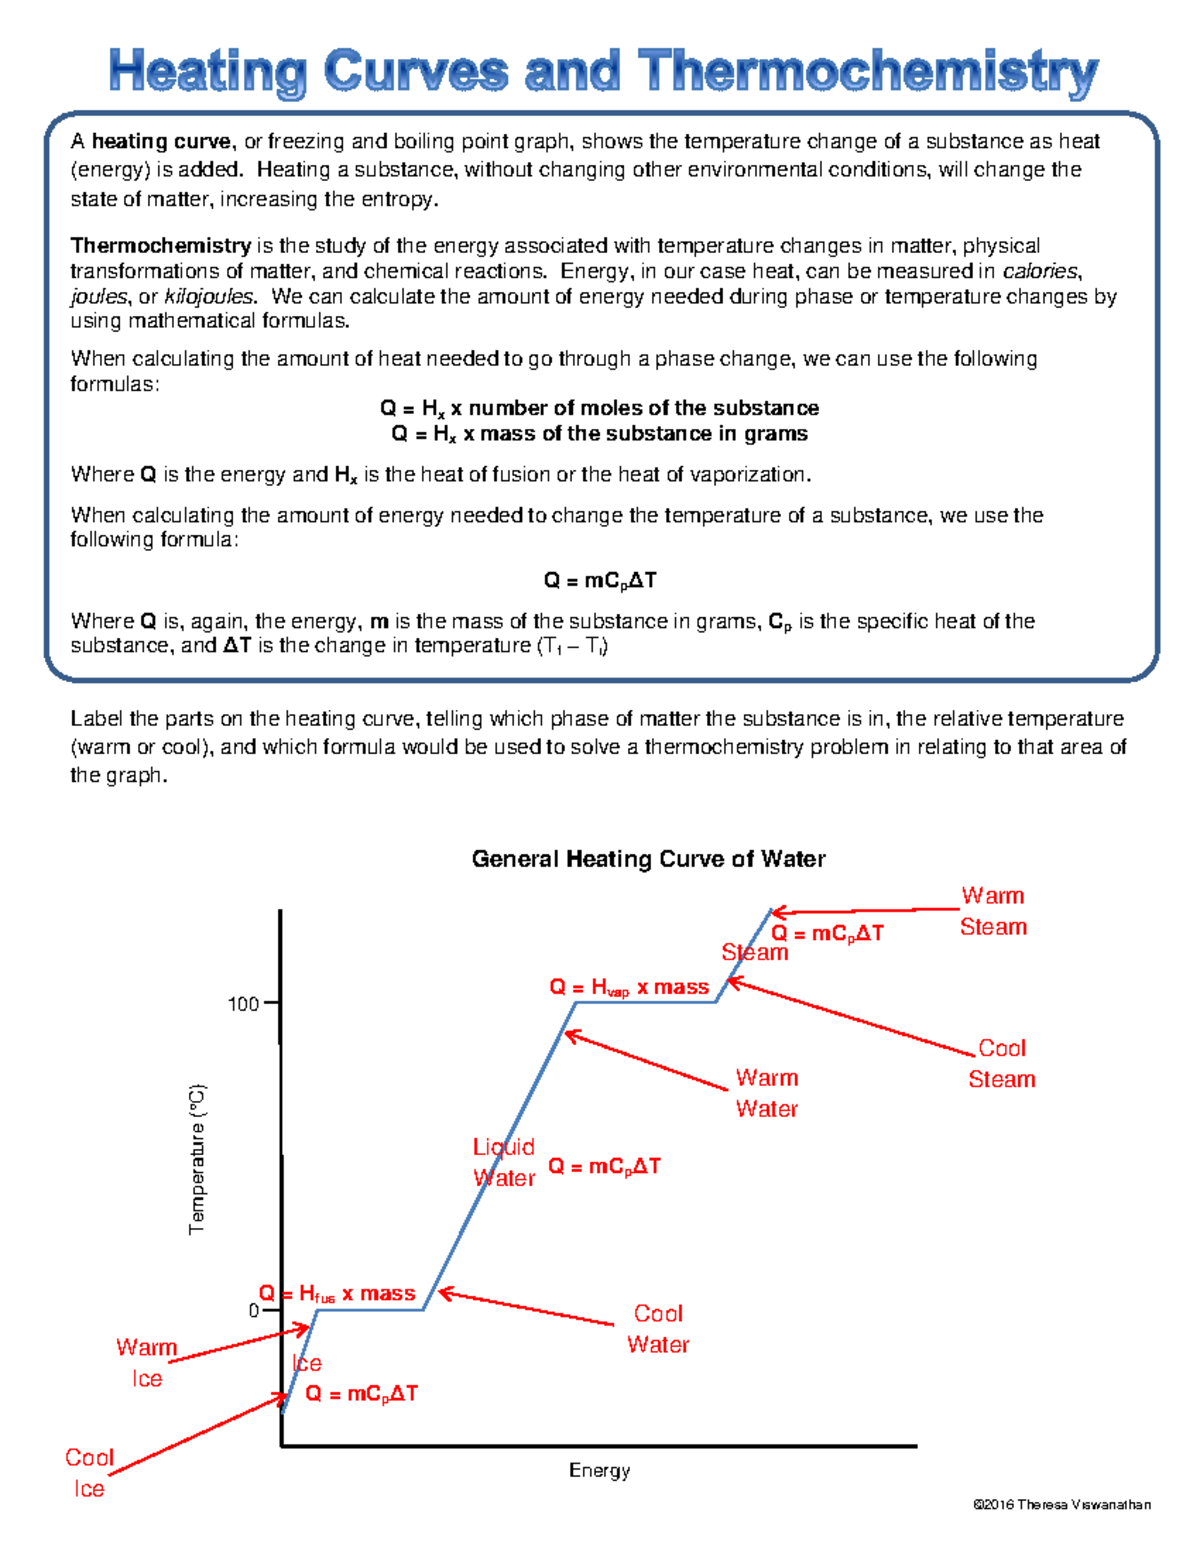
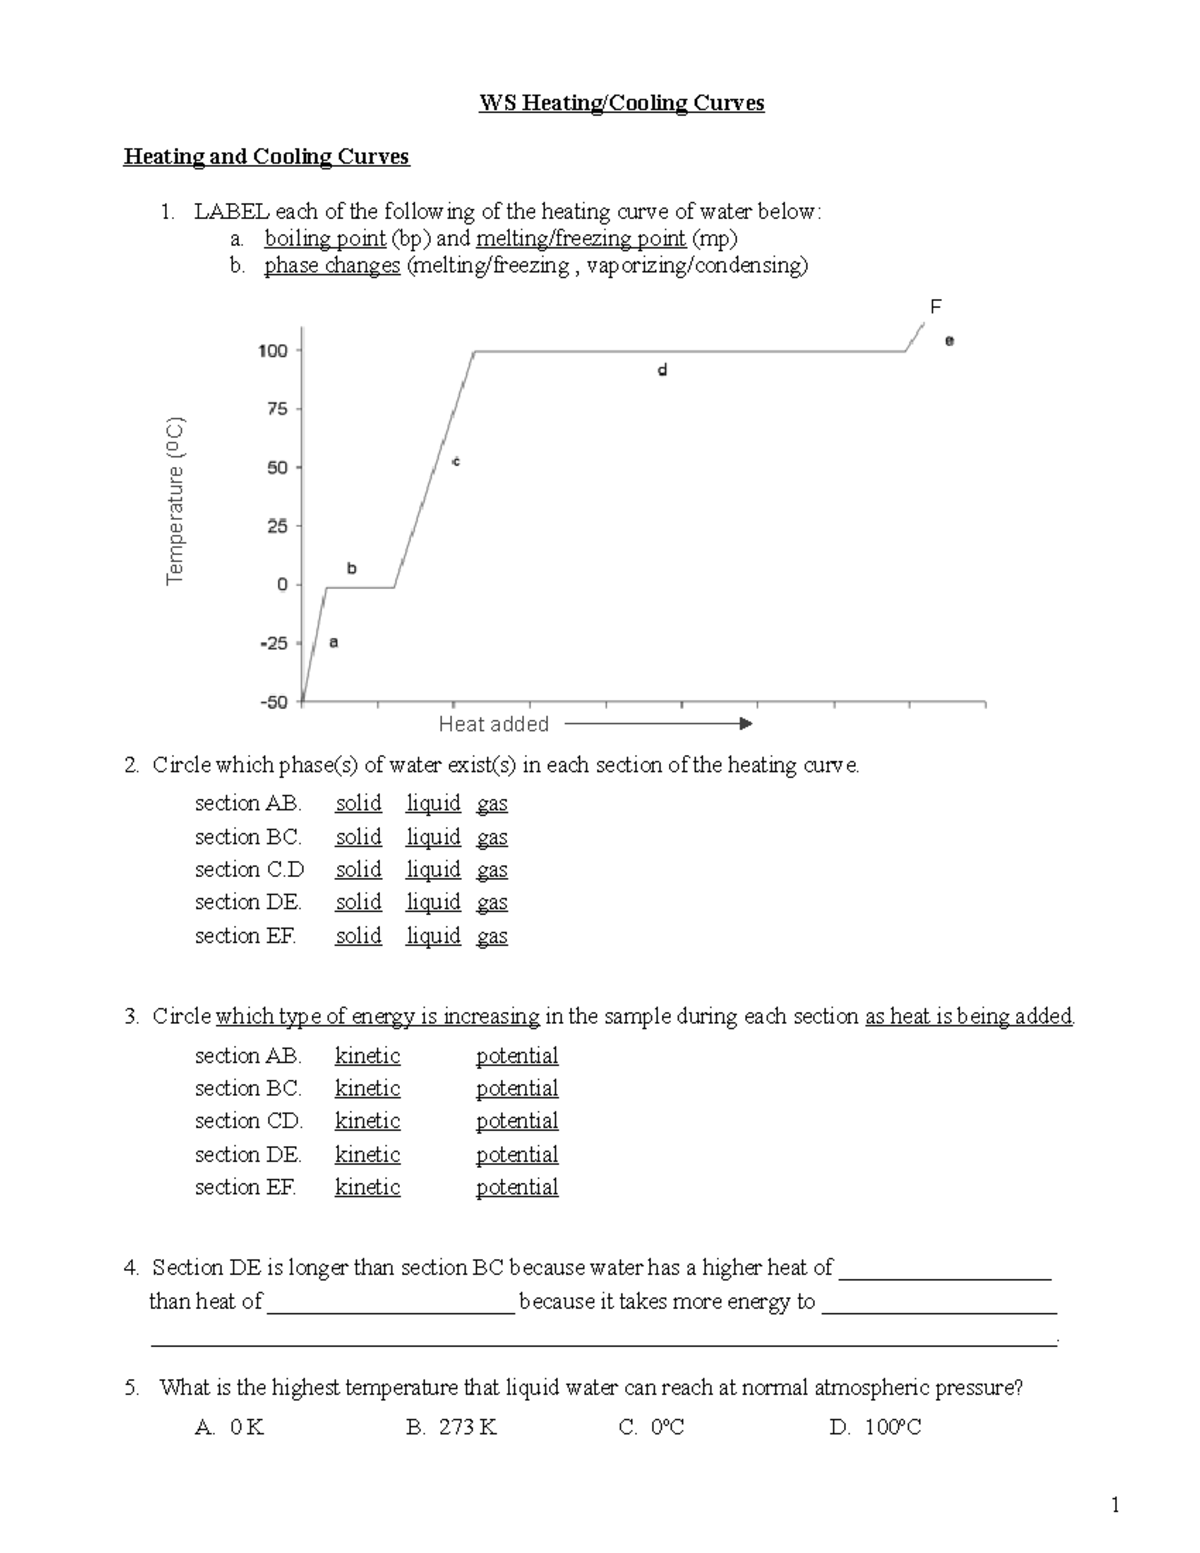
Imagine taking a block of ice at -20°C and slowly adding heat to it. At first, the temperature of the ice will steadily rise until it reaches 0°C. At this point, something interesting happens: even though you’re still adding heat, the temperature stops increasing. Instead, the ice begins to melt, transitioning from a solid to a liquid. This flat portion of the curve represents the latent heat of fusion – the energy required to change the state of the substance without changing its temperature. Once all the ice has melted, the temperature of the liquid water will start to rise again until it reaches 100°C. Again, we see a plateau. This time, the temperature remains constant as the water boils, converting from a liquid to a gas. This plateau represents the latent heat of vaporization. Once all the water has turned into steam, the temperature of the steam will begin to rise as you continue to add heat.
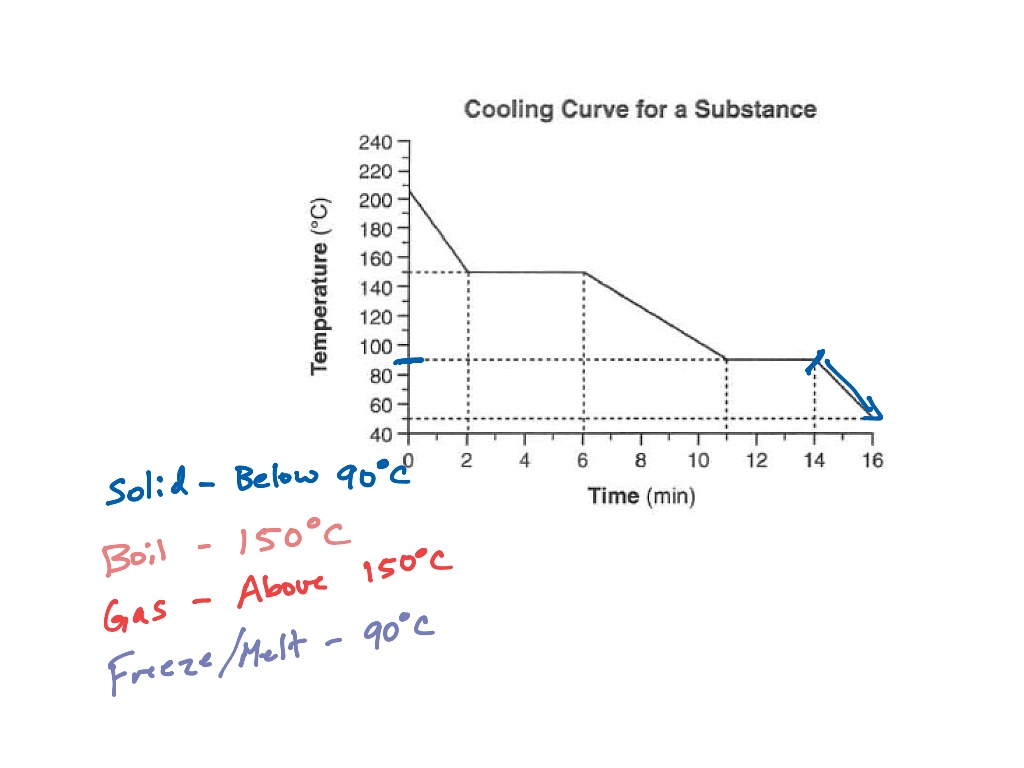
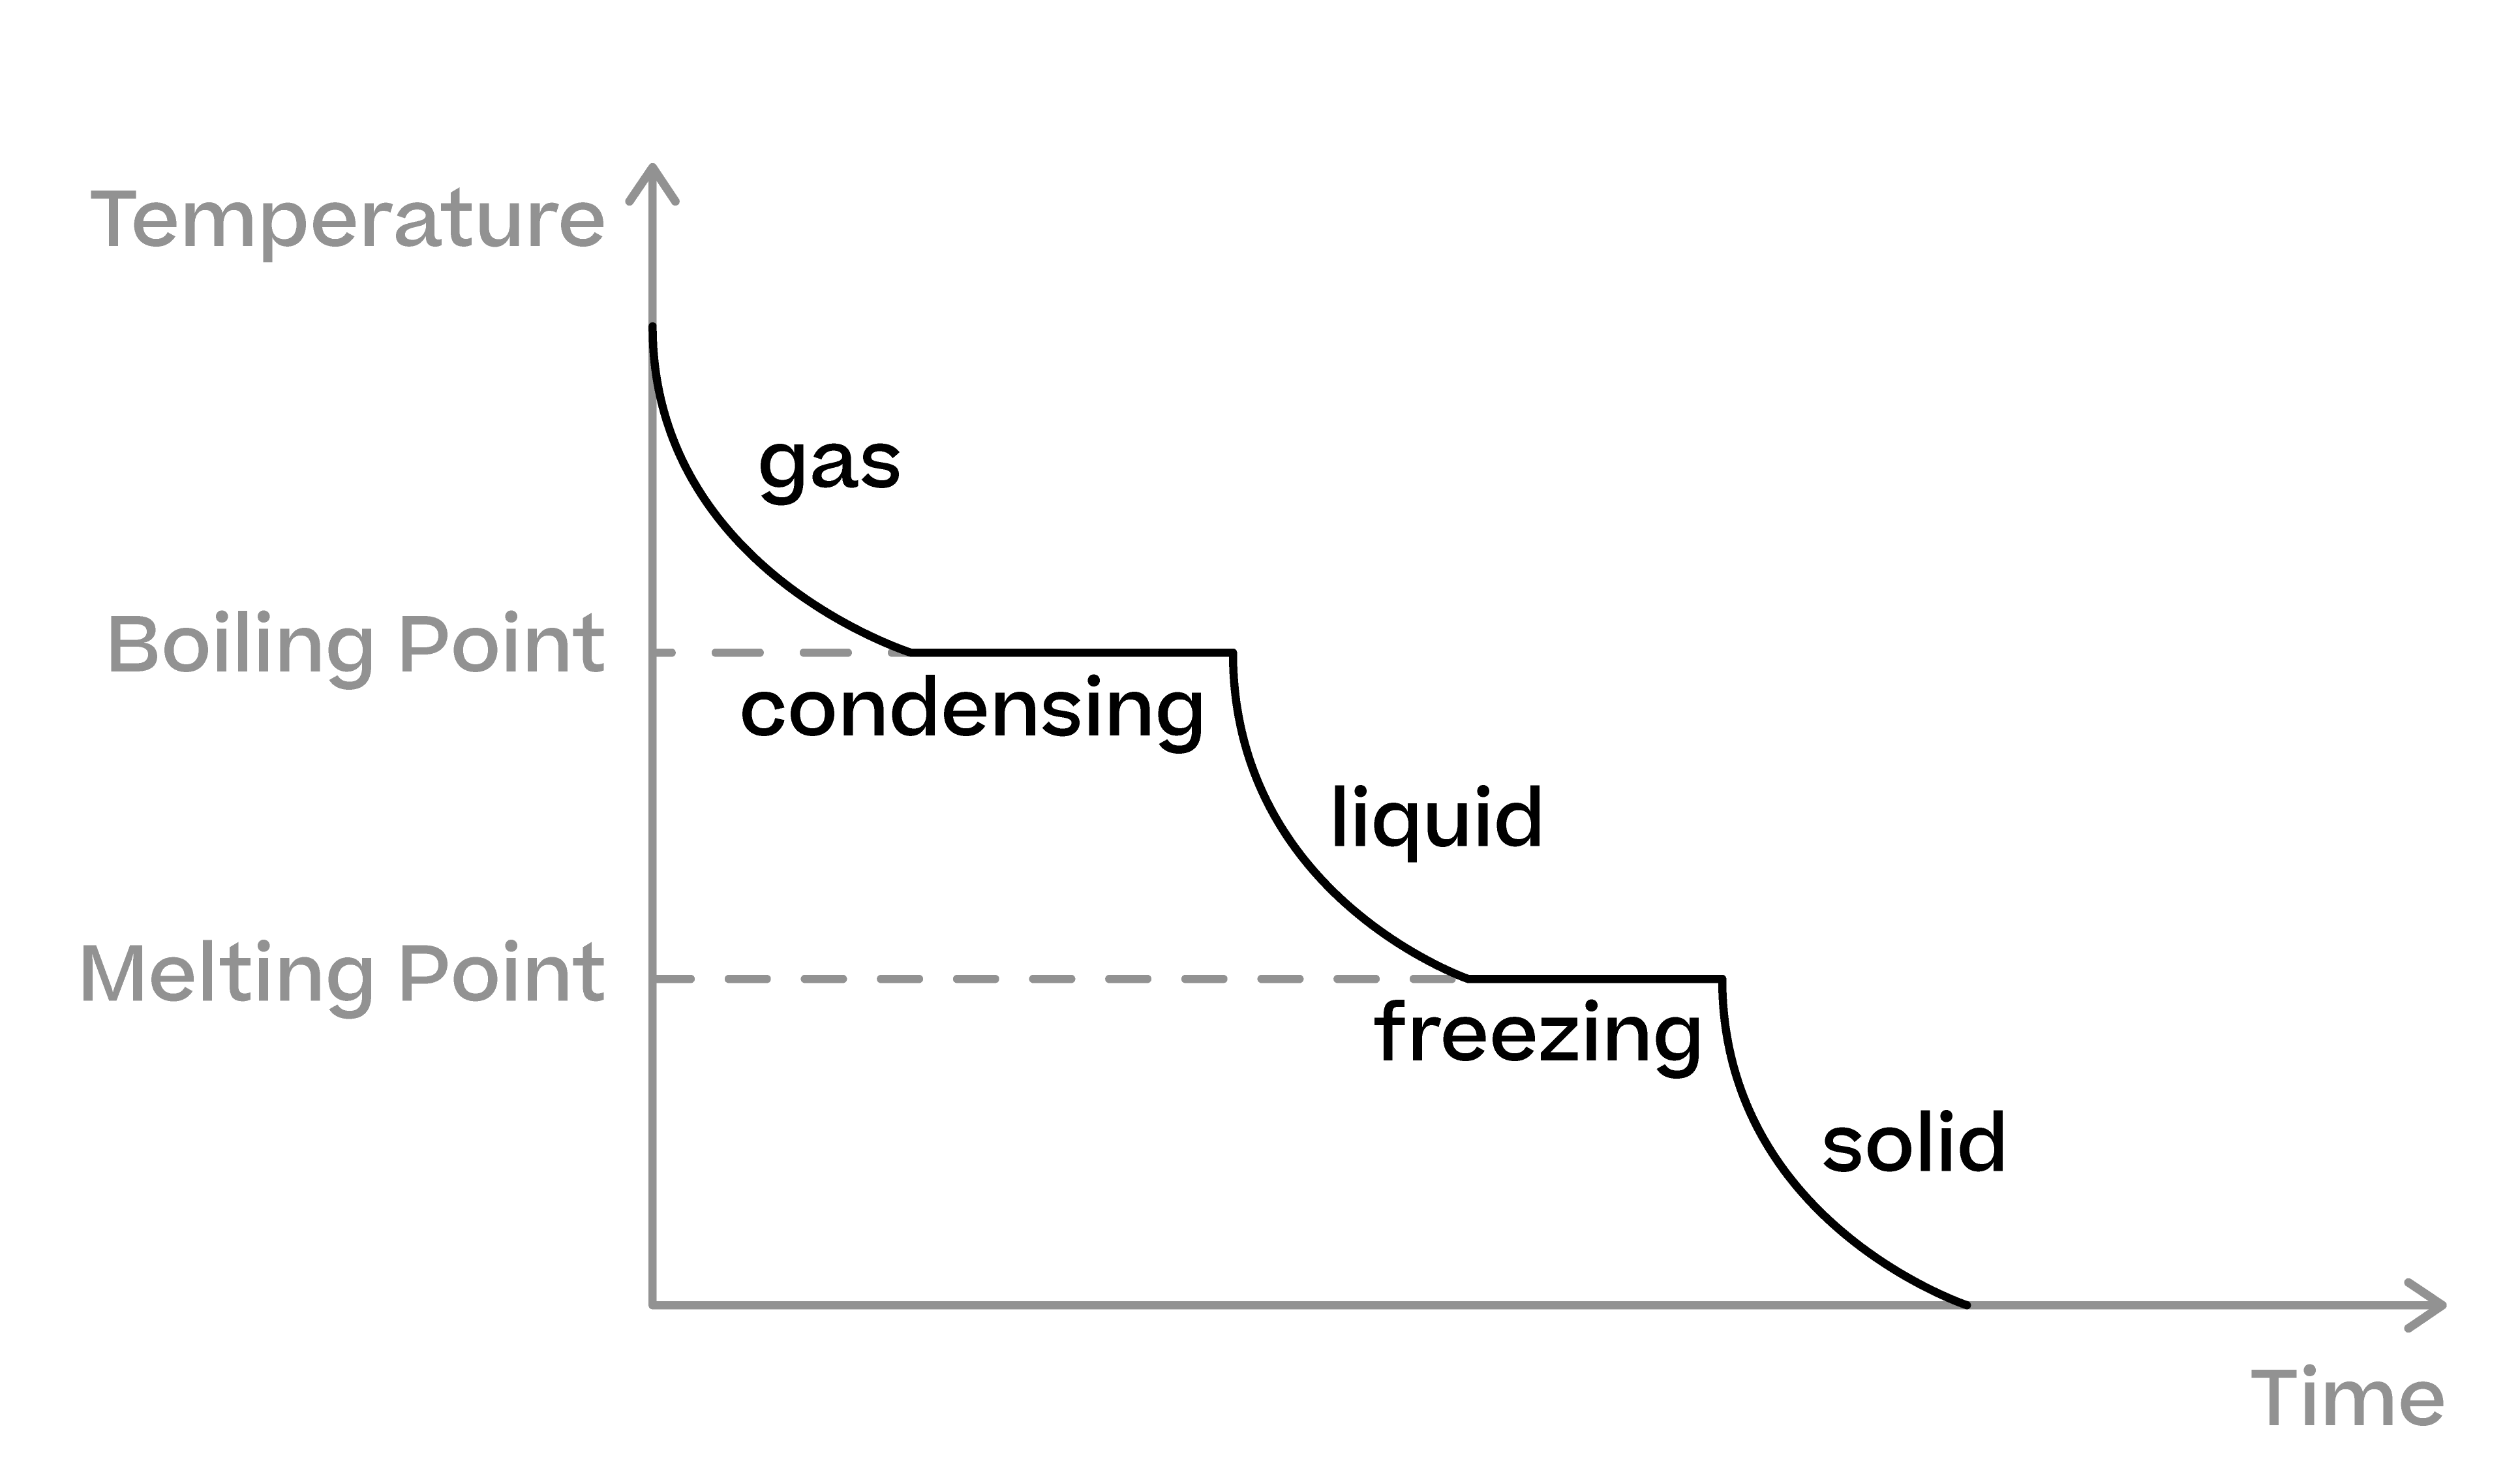
A cooling curve is simply the reverse of this process. Starting with a gas, you remove heat. The gas cools until it reaches its boiling point, where it condenses into a liquid at a constant temperature. Then the liquid cools until it reaches its freezing point, where it solidifies at a constant temperature. Finally, the solid cools further. Both heating and cooling curves demonstrate the principles of energy conservation and the relationship between heat, temperature, and phase transitions.
Working through a Heating And Cooling Curves Worksheet allows students to actively engage with these concepts. These worksheets typically include graphs of heating or cooling curves and a series of questions designed to test understanding. The questions often involve identifying the different states of matter present on the curve, calculating the amount of energy required for specific phase changes using the latent heat values, and comparing the specific heat capacities of the substance in different states. By analyzing these curves and answering the associated questions, students develop a deeper understanding of the thermodynamics of phase transitions.
Furthermore, these worksheets are practical tools for developing critical thinking and problem-solving skills. They encourage students to interpret graphical data, apply relevant formulas, and draw conclusions based on their observations. This hands-on approach is much more effective than passively reading about phase changes in a textbook.
In conclusion, a Heating And Cooling Curves Worksheet is an essential resource for anyone studying thermodynamics and phase transitions. It provides a visual and interactive way to learn about the relationship between heat, temperature, and the states of matter, fostering a deeper understanding of these fundamental scientific principles.
Heating And Cooling Curves Worksheet Answers
Here’s a general guide to the types of answers you might find on a Heating And Cooling Curves Worksheet. Note that the specific answers will depend on the substance being graphed and the specific questions asked on the worksheet. These are just examples to illustrate the concepts.
Typical Questions and Answers:
-
Question: Identify the sections of the graph where the substance is a solid.
- Answer: Look for the segments of the graph with a positive slope before the first plateau and after the last plateau (in a cooling curve) or the first segment with a positive slope (in a heating curve). This is where the temperature of the solid is changing. There also may be a horizontal line where the substance is in solid form during a phase change.
-
Question: Identify the sections of the graph where the substance is a liquid.
- Answer: Look for the segments of the graph with a positive slope between the first and second plateaus (in a heating curve) or between the last and second to last plateaus (in a cooling curve). This is where the temperature of the liquid is changing.
-
Question: Identify the sections of the graph where the substance is a gas.
- Answer: Look for the segments of the graph with a positive slope after the second plateau (in a heating curve) or before the second to last plateau (in a cooling curve). This is where the temperature of the gas is changing.
-
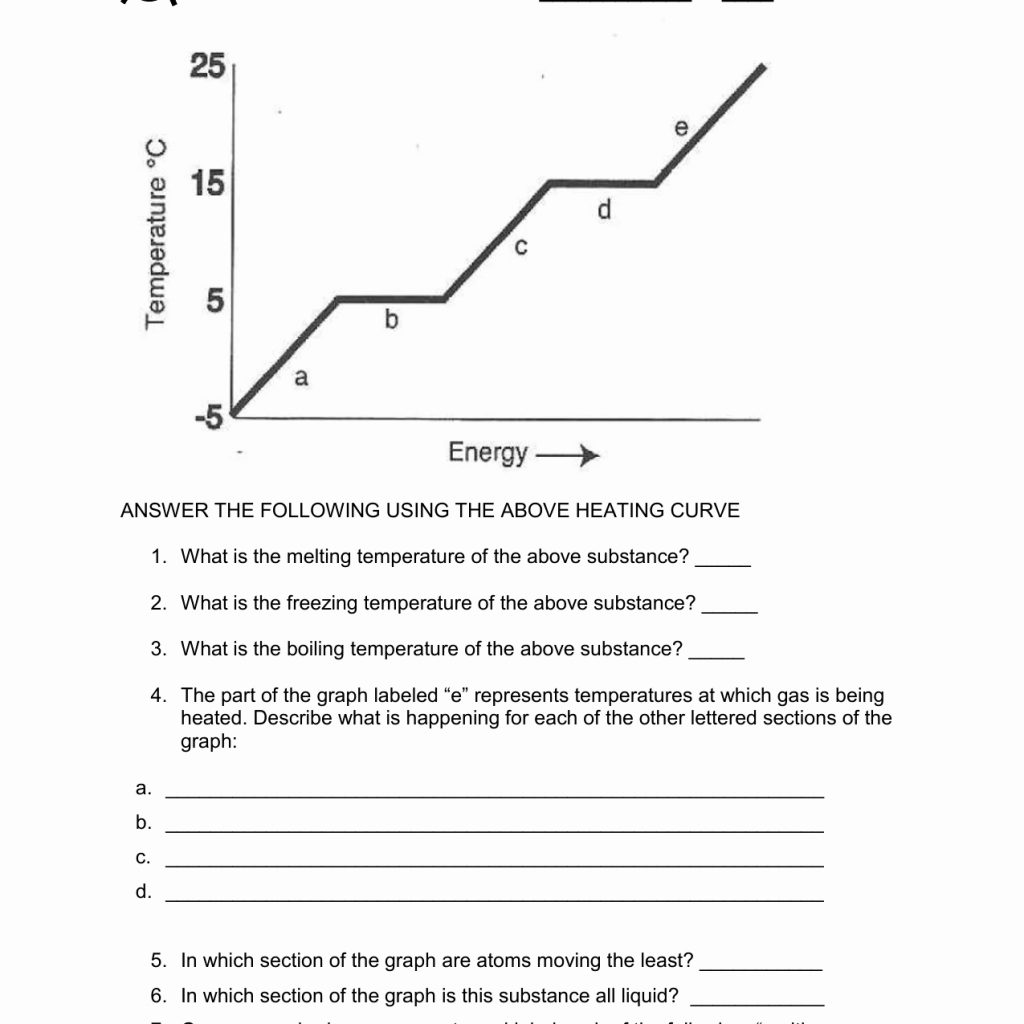
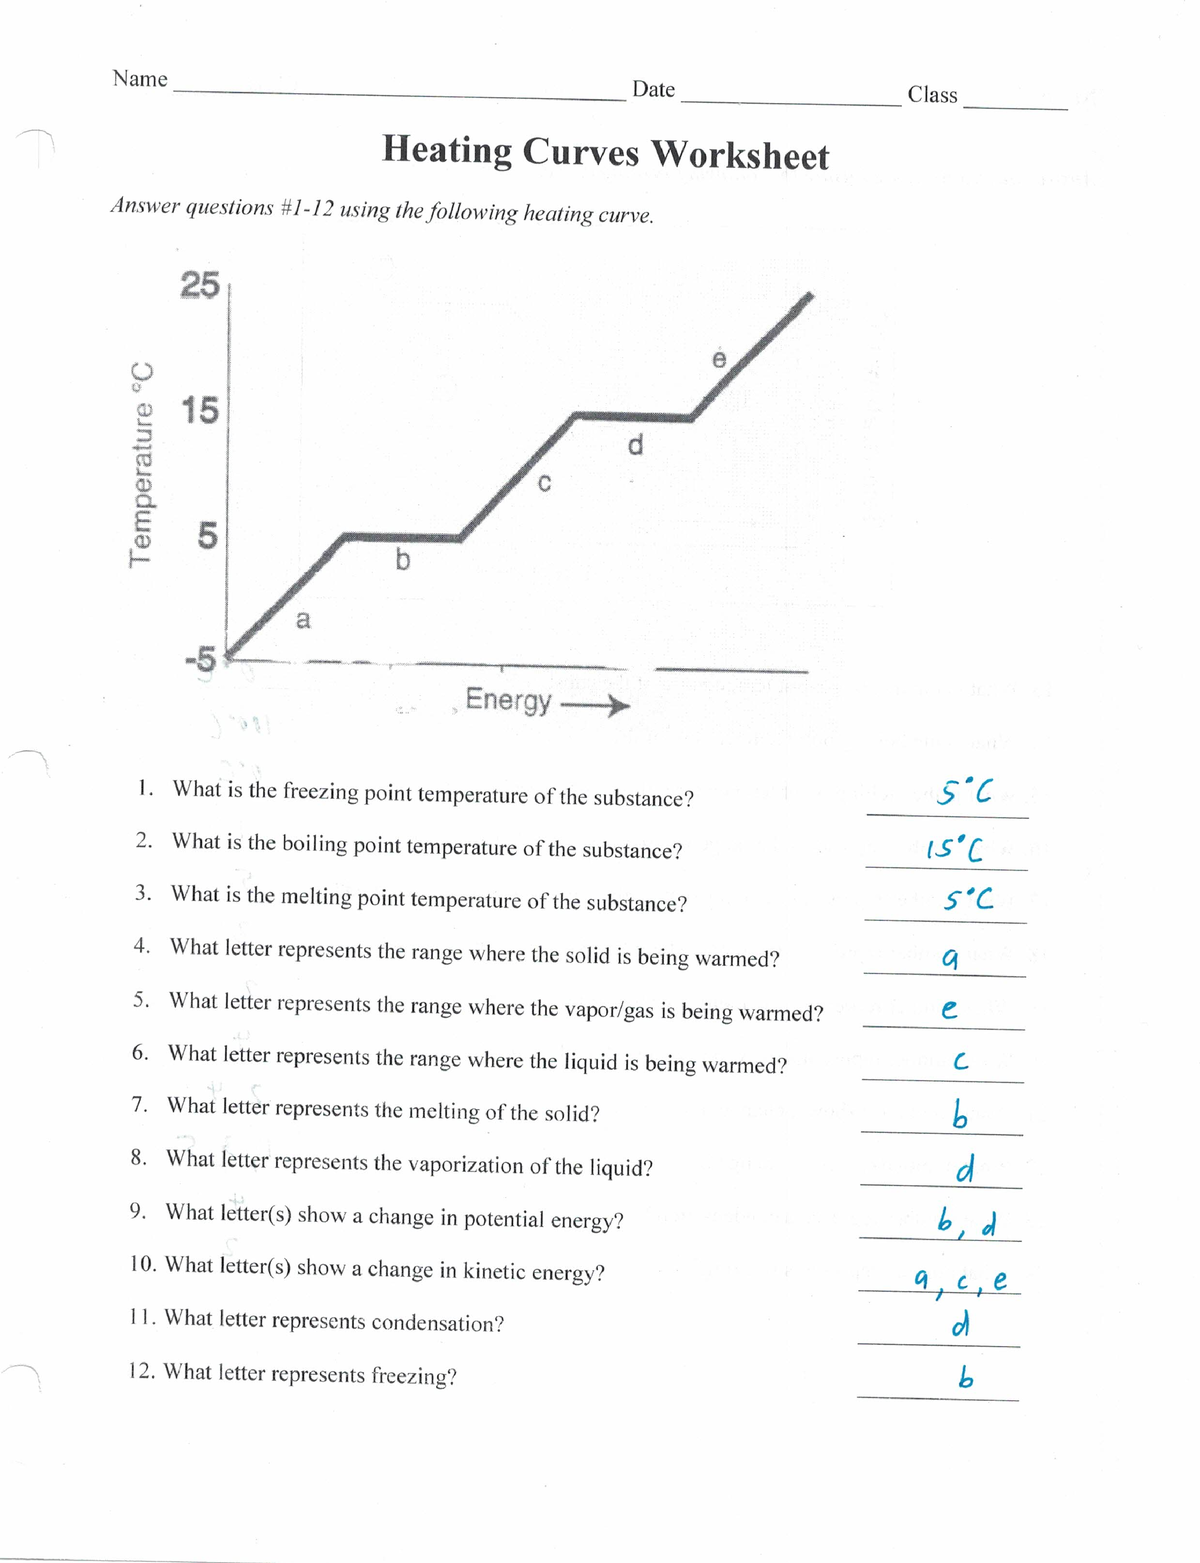
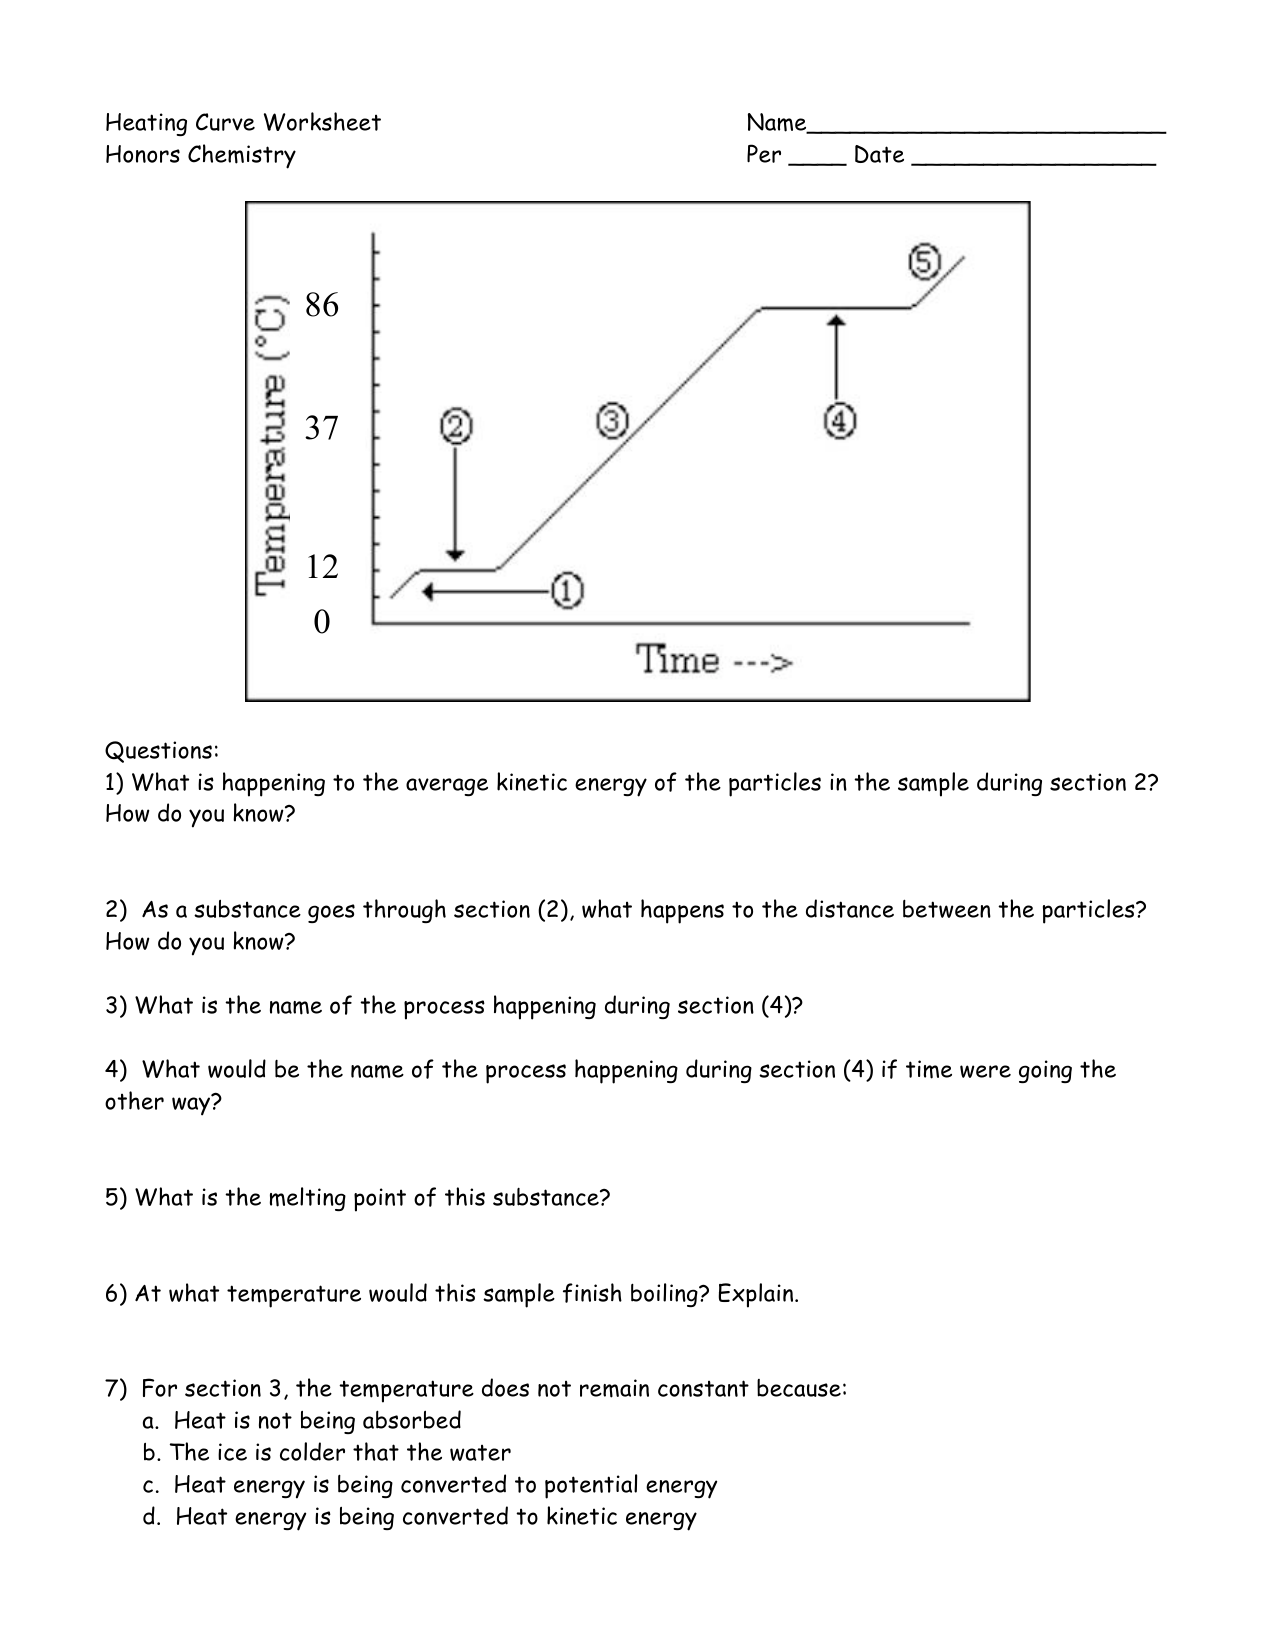
Question: At what temperature does melting occur?
- Answer: Identify the first plateau on the heating curve. The temperature at this plateau is the melting point.
-
Question: At what temperature does boiling occur?
- Answer: Identify the second plateau on the heating curve. The temperature at this plateau is the boiling point.
-
Question: What is the freezing point of the substance?
- Answer: Identify the last plateau on the cooling curve. The temperature at this plateau is the freezing point (which is the same as the melting point).
-
Question: What is the condensation point of the substance?
- Answer: Identify the second to last plateau on the cooling curve. The temperature at this plateau is the condensation point (which is the same as the boiling point).
-
Question: During which section(s) is potential energy increasing?
- Answer: During the plateaus, where phase changes are occurring (melting and boiling on a heating curve; condensation and freezing on a cooling curve). The energy is being used to break intermolecular forces rather than increase the temperature.
-
Question: During which section(s) is kinetic energy increasing?
- Answer: During the segments with positive slopes, where the temperature is increasing (while the substance is in a solid, liquid, or gaseous state).
-
Question: Calculate the heat required to melt [mass] grams of the substance. (Given the latent heat of fusion).
- Answer: Use the formula: Q = m * Lf, where Q is the heat, m is the mass, and Lf is the latent heat of fusion. For example, if the latent heat of fusion is 334 J/g and the mass is 10g, Q = 10g * 334 J/g = 3340 J.
-
Question: Calculate the heat required to raise the temperature of [mass] grams of the substance by [temperature difference] degrees Celsius in the liquid phase. (Given the specific heat capacity).
- Answer: Use the formula: Q = m * c * ΔT, where Q is the heat, m is the mass, c is the specific heat capacity, and ΔT is the temperature change. For example, if the specific heat capacity is 4.184 J/g°C, the mass is 10g, and the temperature change is 20°C, then Q = 10g * 4.184 J/g°C * 20°C = 836.8 J.
If you are searching about Heating And Cooling Curves Worksheet – Educational Worksheet you’ve came to the right place. We have 20 Pics about Heating And Cooling Curves Worksheet – Educational Worksheet like Heating and Cooling Curves Worksheet Lovely Quiz & Worksheet Heating, Heating And Cooling Curves Worksheet – Ame.my.id and also Perfect Info About How To Draw A Cooling Curve – Partnershipcopy26. Here it is:
Heating And Cooling Curves Worksheet – Educational Worksheet
educational-worksheet.blogspot.com
SOLUTION: Heating Curves Practice Answer Key – Studypool – Worksheets

worksheets.clipart-library.com
Heating And Cooling Curves Worksheets
www.housview.com
Perfect Info About How To Draw A Cooling Curve – Partnershipcopy26

partnershipcopy26.pythonanywhere.com
8-22-18 – Heating And Cooling Curve Answers – General Chemistry
www.studocu.com
Heating And Cooling Curve Worksheet

www.proworksheet.my.id
Heating And Cooling Curves Worksheet – Ame.my.id

ame.my.id
Heating Curves And Thermochemistry – Key – A Heating Curve, Or Freezing
www.studocu.com
Heating And Cooling Curves Worksheet – Ame.my.id
ame.my.id
Reading The Heating/cooling Curve Worksheet
studylibsmith.z21.web.core.windows.net
Free Printable HVAC Basic Air Conditioning Worksheet Part 1
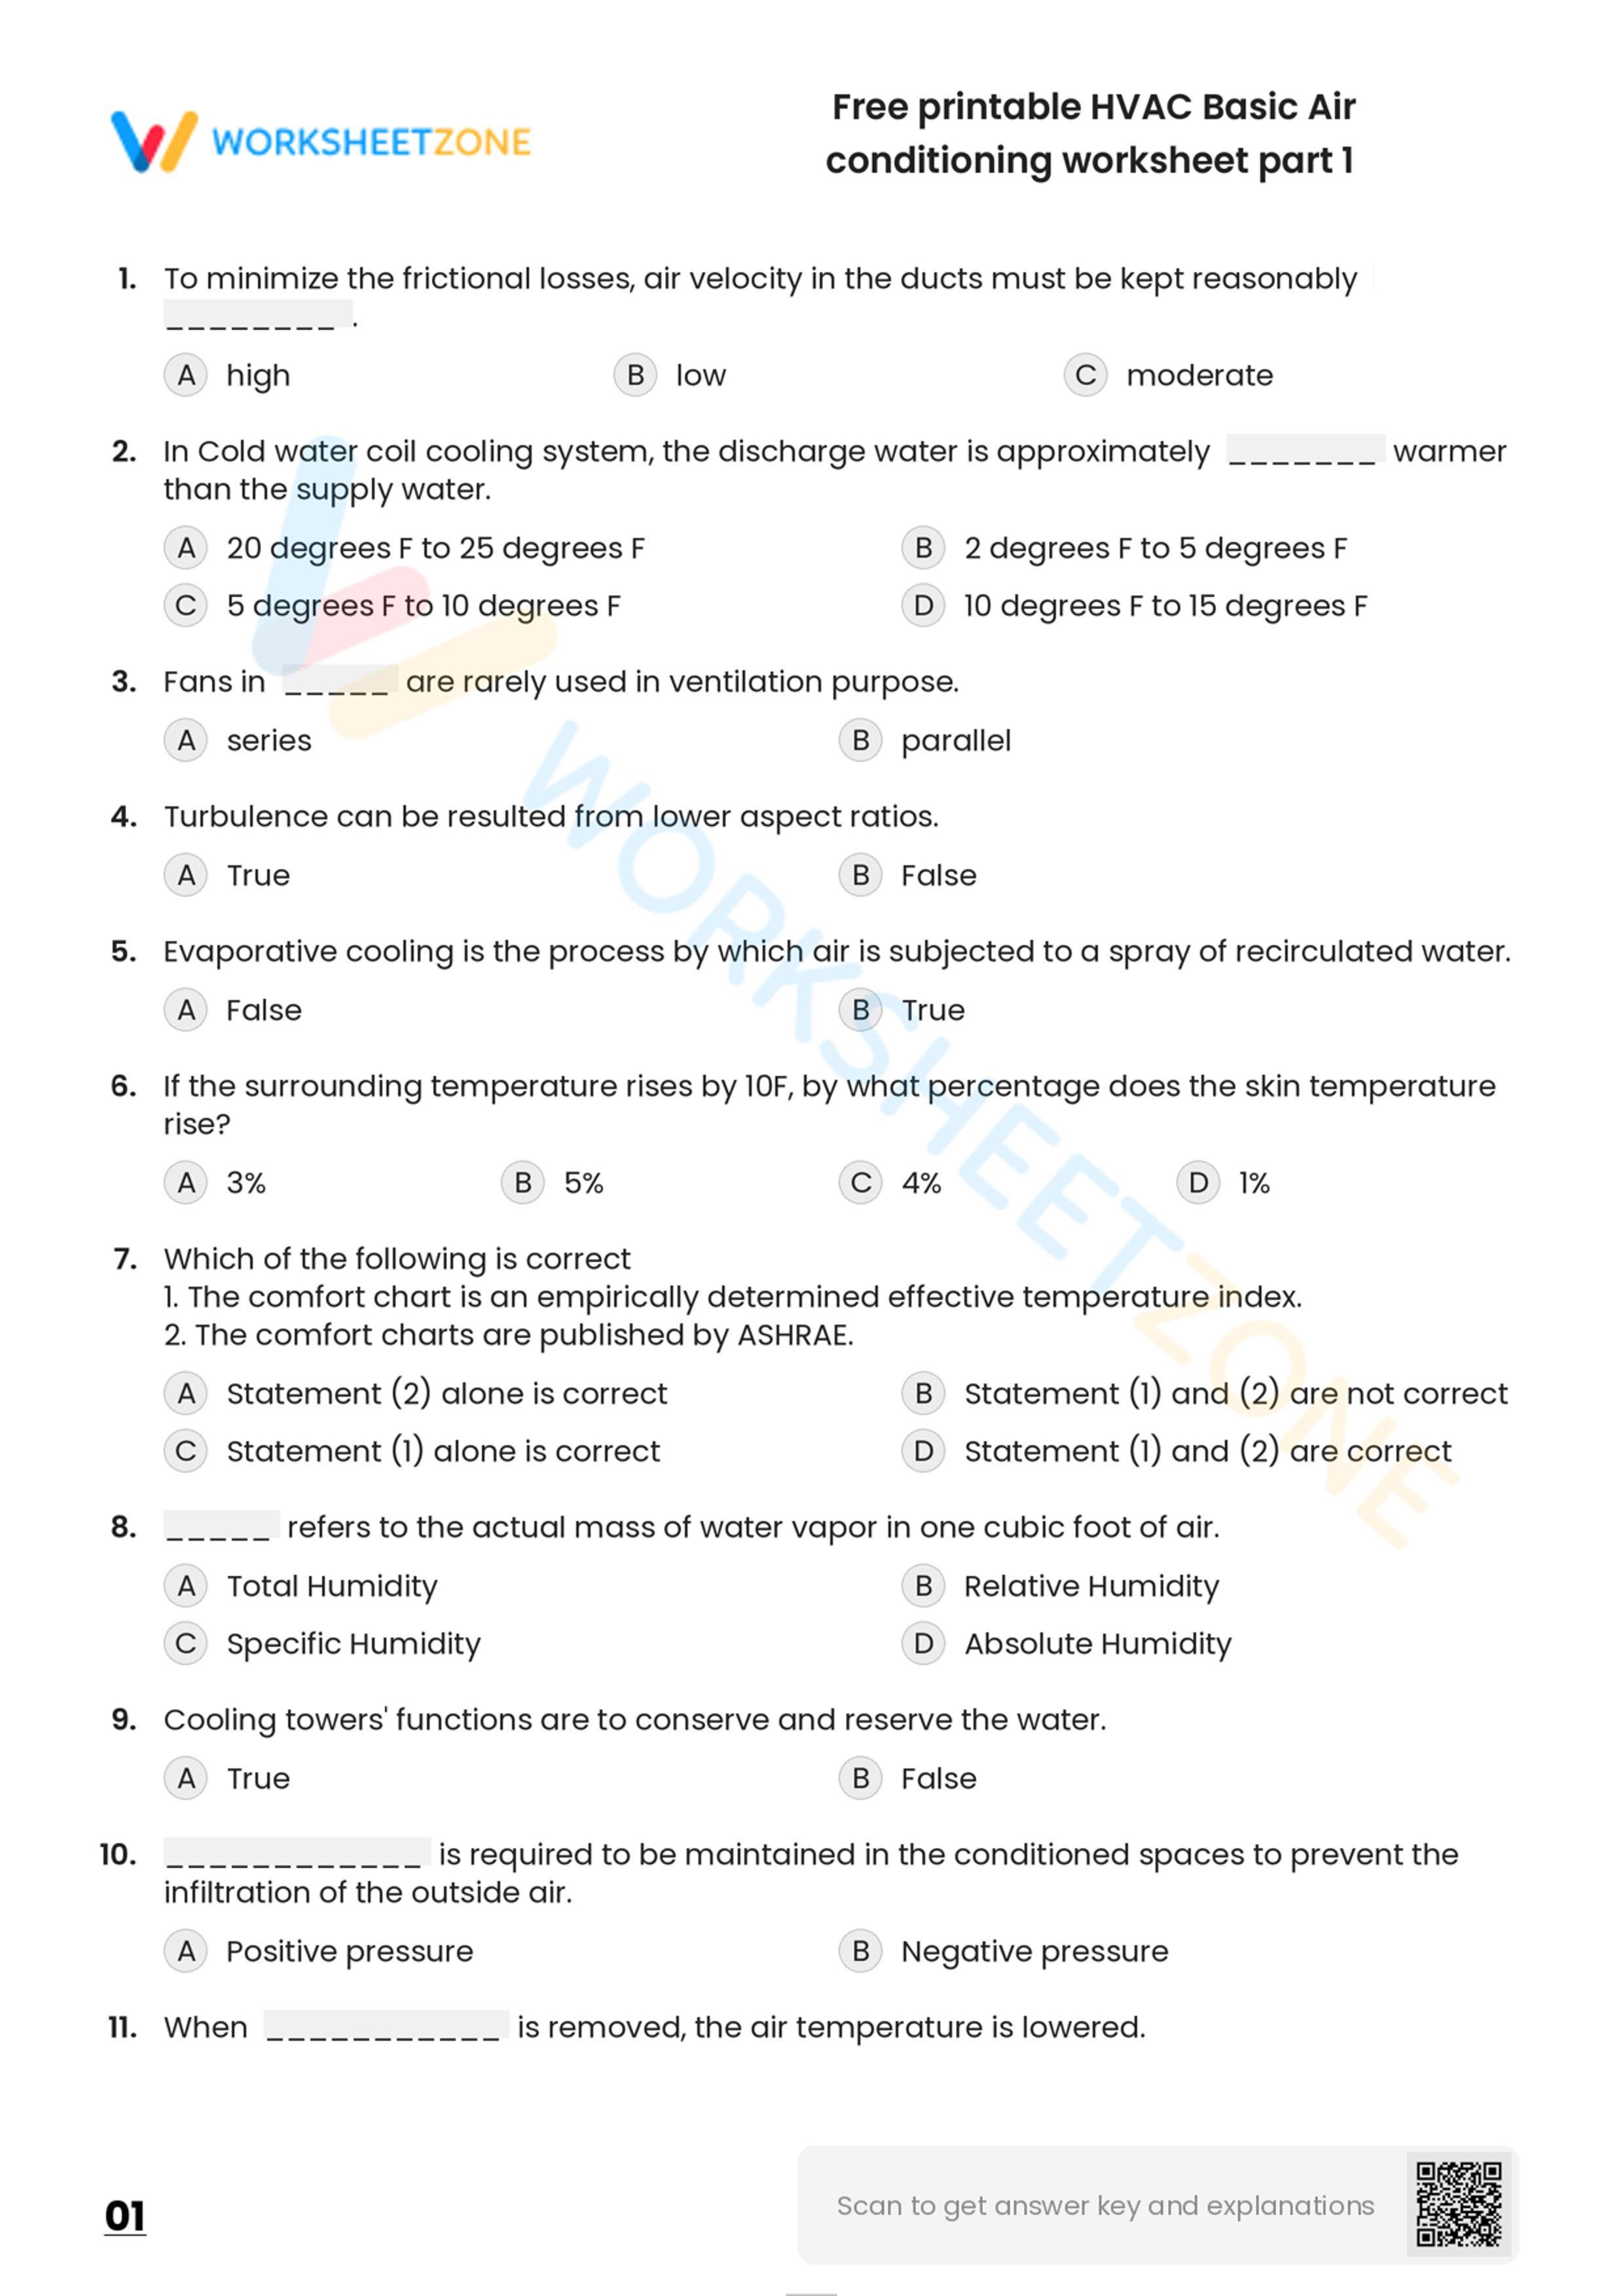
worksheetzone.org
Heating And Cooling Curves Worksheet – ChemTribe

chemtribe.com
Heating And Cooling Worksheet 1 – Name: Date: Worksheet One This
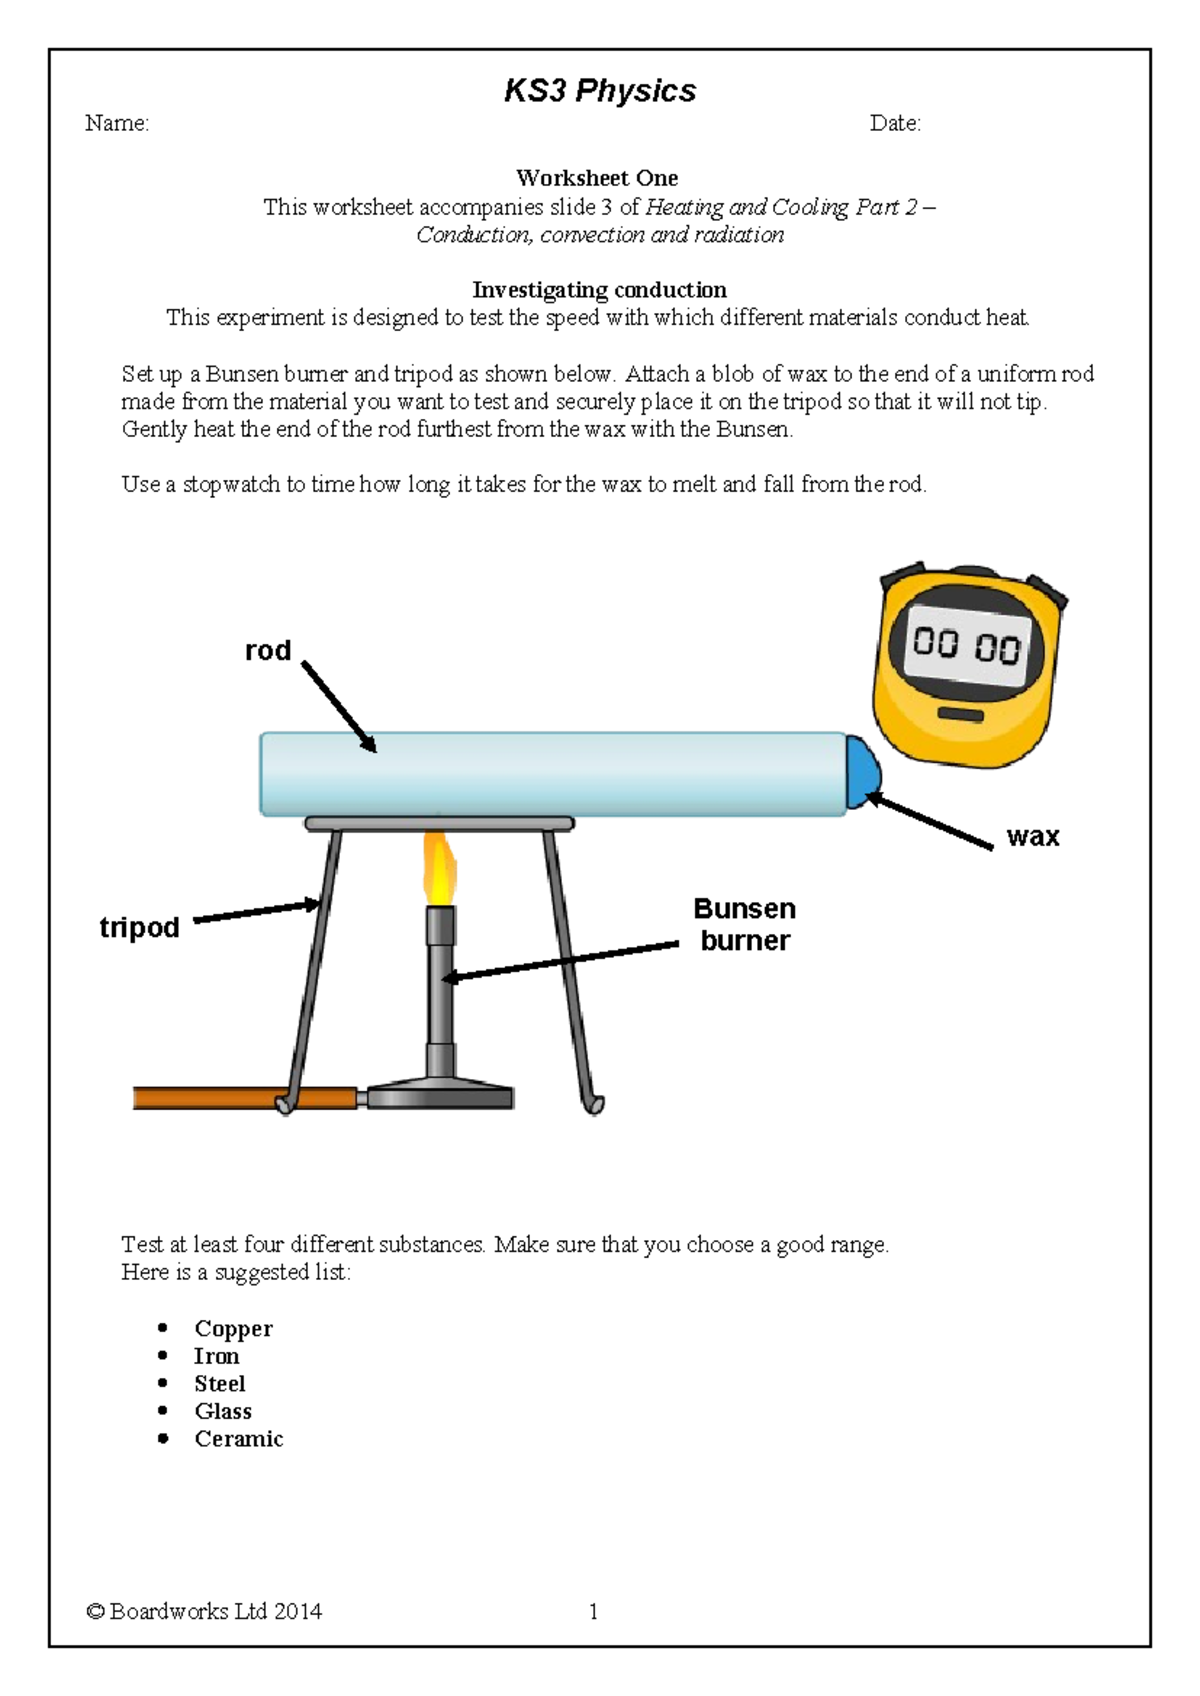
www.studocu.com
Heating And Cooling Curves Worksheet Lovely Quiz & Worksheet Heating
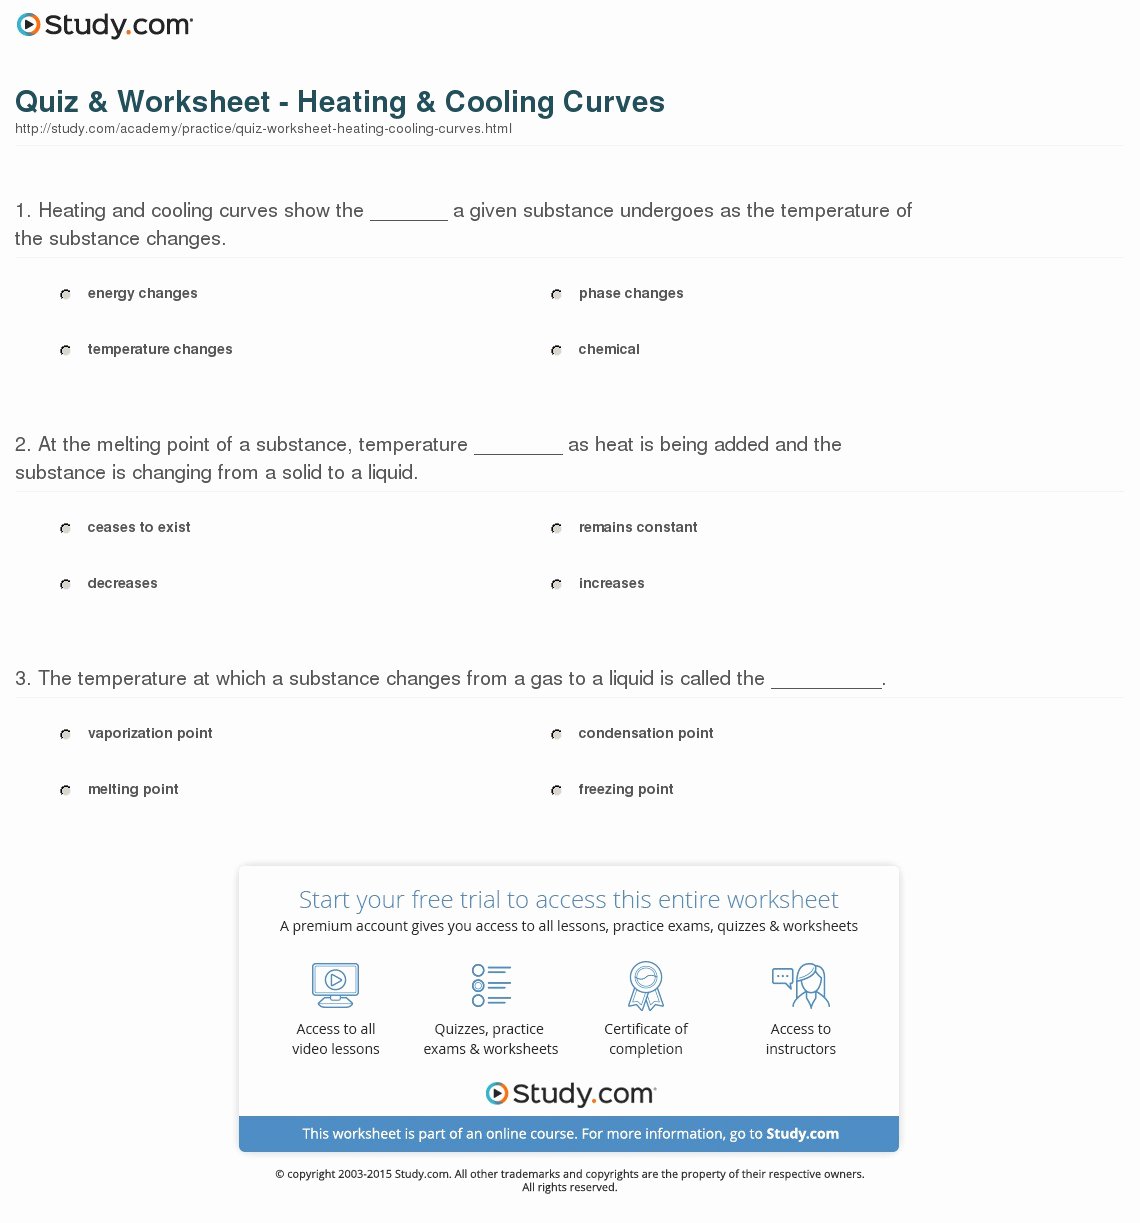
chessmuseum.org
Heating And Cooling Curves Worksheet – Owhentheyanks.com

www.owhentheyanks.com
Heating Curves Worksheet Answers – Printable Word Searches
davida.davivienda.com
Solved Using The Cooling Curves Provided Below Constr – Vrogue.co
www.vrogue.co
Cooling Curves Copy – Heat – Calorimetery Cooling Curves Lab Report. In
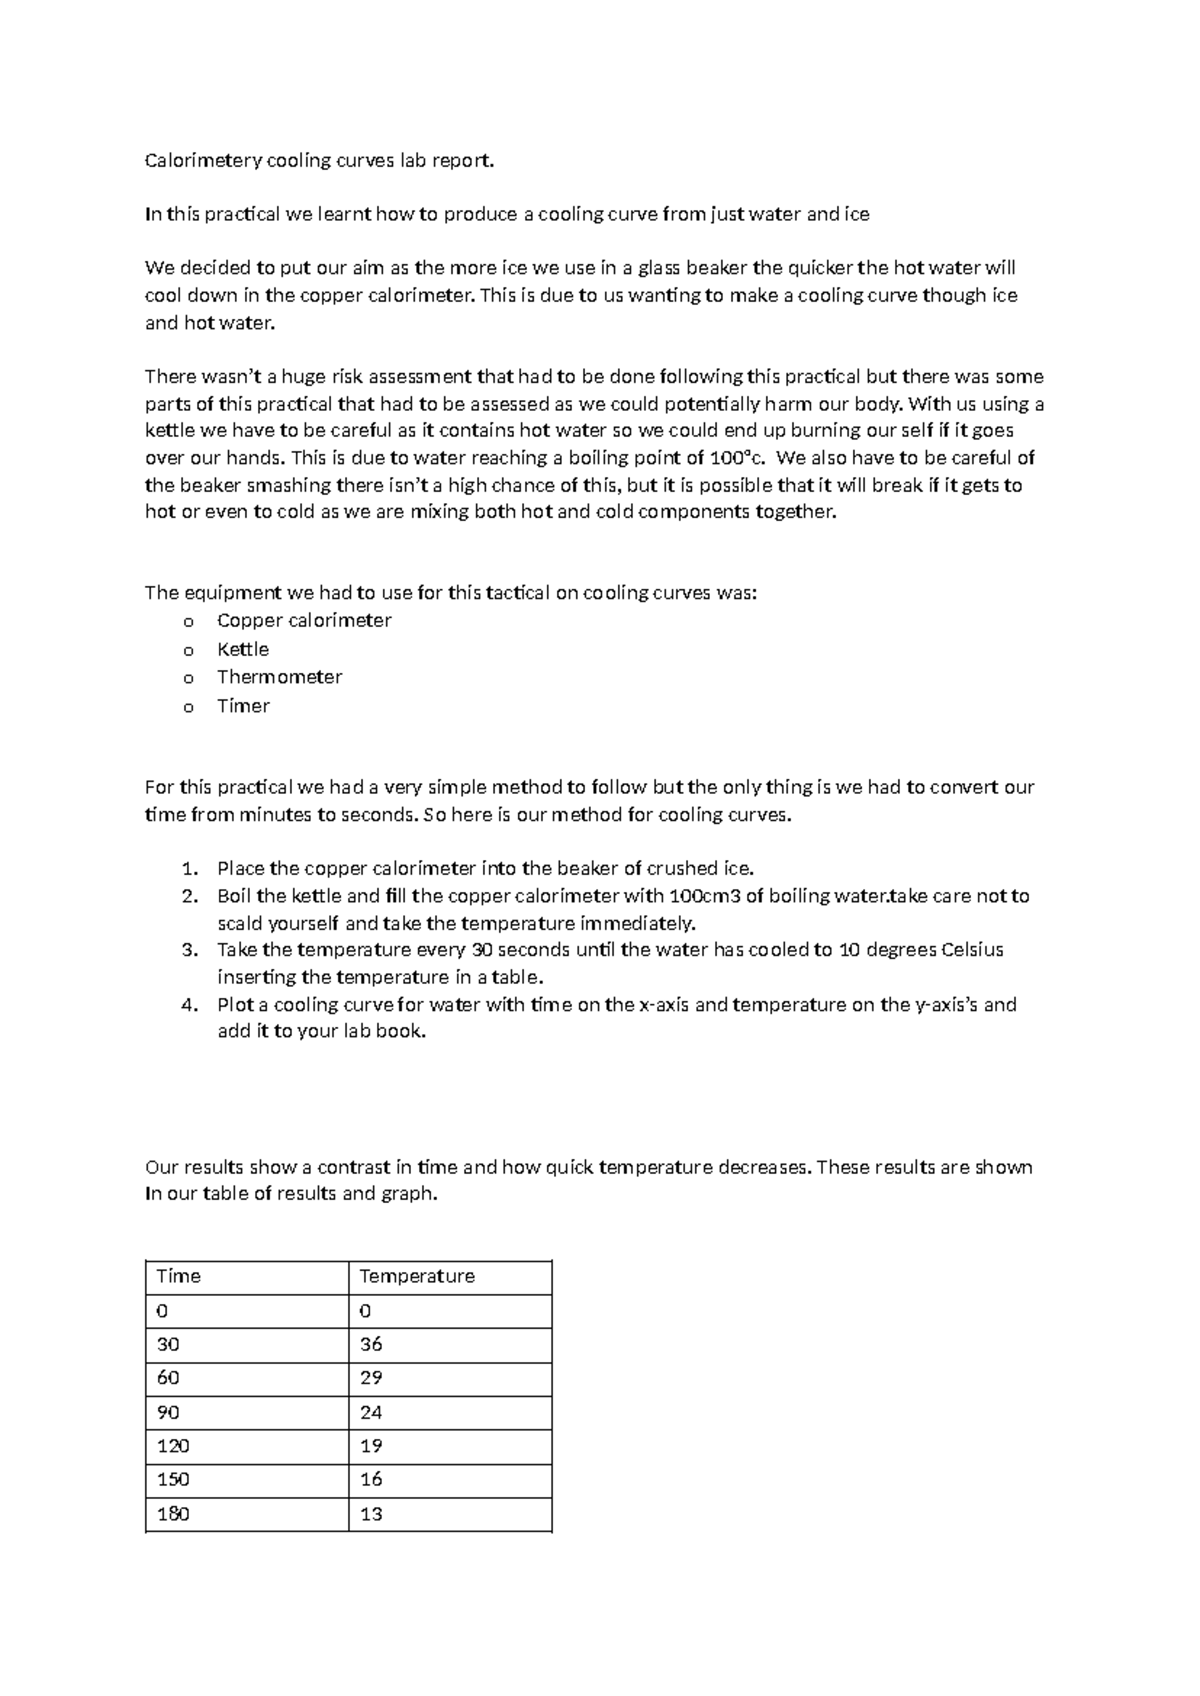
www.studocu.com
Everyday Changes: Heating And Cooling | Top Teacher

topteacher.com.au
Heating And Cooling Curves Lab At Robbin Wood Blog
storage.googleapis.com
Heating curves and thermochemistry. Reading the heating/cooling curve worksheet. Free printable hvac basic air conditioning worksheet part 1