Understanding data is crucial in today’s world. From analyzing business performance to interpreting scientific research, we’re constantly bombarded with information. One of the fundamental tools for making sense of this data is understanding measures of central tendency. These measures provide a single, representative value that summarizes the overall “center” or “typical” value within a dataset. A helpful way to learn and practice these concepts is by using a well-designed “Measure of Central Tendency Worksheet.” These worksheets offer a range of problems, from simple calculations to more complex scenarios, allowing students and professionals alike to solidify their understanding of mean, median, and mode. They often include word problems that apply these statistical concepts to real-world situations.
What are Measures of Central Tendency?
Measures of central tendency are statistical values that represent the “center” of a distribution. They offer a way to summarize a large set of data with a single, meaningful number. There are three main measures of central tendency:
- Mean: The arithmetic average of a dataset. It’s calculated by summing all the values and dividing by the number of values. The mean is sensitive to outliers (extreme values).
- Median: The middle value in a dataset when the data is arranged in ascending order. If there is an even number of data points, the median is the average of the two middle values. The median is less sensitive to outliers than the mean.
- Mode: The value that appears most frequently in a dataset. A dataset can have no mode, one mode (unimodal), or multiple modes (bimodal, trimodal, etc.). The mode is useful for identifying the most common value in a dataset.
Choosing the appropriate measure of central tendency depends on the nature of the data and the specific question you’re trying to answer. For example, if you want to know the typical income in a neighborhood and there are a few very wealthy residents, the median might be a better choice than the mean because it’s less affected by those extreme incomes.
Example Measure of Central Tendency Worksheet Answers
Let’s imagine a hypothetical Measure of Central Tendency Worksheet with several problems. Below are examples of the types of problems you might find and their solutions. Keep in mind, a real worksheet will likely have many more questions and varying levels of difficulty.
Problem 1: Finding the Mean
Question: Calculate the mean of the following dataset: 5, 8, 12, 6, 9
Solution:
- Add the numbers together: 5 + 8 + 12 + 6 + 9 = 40
- Divide by the number of values (5): 40 / 5 = 8
- Answer: The mean is 8.
Problem 2: Finding the Median
Question: Calculate the median of the following dataset: 15, 22, 18, 25, 20
Solution:
- Arrange the data in ascending order: 15, 18, 20, 22, 25
- Identify the middle value: 20
- Answer: The median is 20.
Problem 3: Finding the Mode
Question: Calculate the mode of the following dataset: 3, 7, 5, 3, 9, 3, 2
Solution:
- Count the frequency of each value:
- 3 appears 3 times
- 7 appears 1 time
- 5 appears 1 time
- 9 appears 1 time
- 2 appears 1 time
- Identify the value that appears most frequently: 3
- Answer: The mode is 3.
Problem 4: Combined Measures and Outliers
Question: The ages of five students are: 20, 22, 21, 23, 65. Calculate the mean, median, and mode. Which measure best represents the “typical” age of a student in this group?
Solution:
- Mean: (20 + 22 + 21 + 23 + 65) / 5 = 151 / 5 = 30.2
- Median: Arrange in order: 20, 21, 22, 23, 65. The median is 22.
- Mode: There is no mode (all values appear only once).
- Answer:
- Mean: 30.2
- Median: 22
- Mode: None
- The median (22) best represents the typical age because the mean is significantly affected by the outlier age of 65.
By working through these types of problems, users can develop a strong foundation in understanding and applying measures of central tendency. Remember to pay attention to the context of the data and choose the measure that best represents the information you’re trying to convey. Practice makes perfect!
If you are looking for Measures Of Central Tendency Mean Median Mode Printable Color By you’ve visit to the right place. We have 20 Images about Measures Of Central Tendency Mean Median Mode Printable Color By like Central tendency and spread¦KS4-5 maths¦Teachit – Worksheets Library, Measures Of Central Tendency Worksheet – Pro Worksheet and also SOLUTION: Measure of central tendency 2 worksheet 1 – Studypool. Here you go:
Measures Of Central Tendency Mean Median Mode Printable Color By

worksheets.clipart-library.com
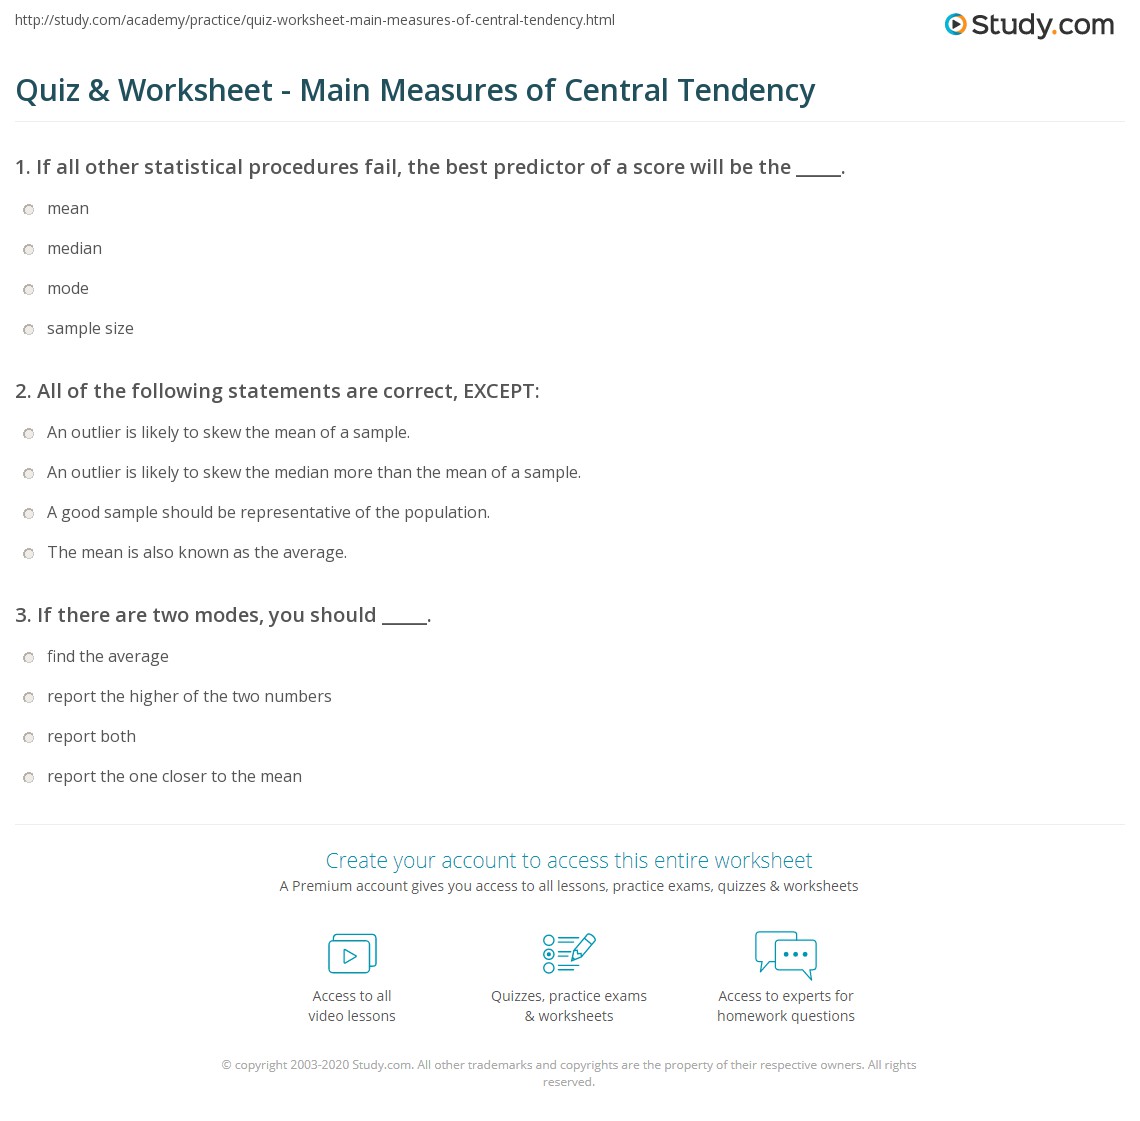
Quiz & Worksheet – Main Measures Of Central Tendency | Study.com
worksheets.clipart-library.com
SOLUTION: Measure Of Central Tendency 2 Worksheet 1 – Studypool

www.studypool.com
SOLUTION: Worksheet 3 Measures Of Central Tendency 4 – Studypool

www.studypool.com
Choosing The Best Measure Of Central Tendency | Central Tendency, Sixth

www.pinterest.com
Measures Of Central Tendency Worksheet – Pro Worksheet

www.proworksheet.my.id
SOLUTION: Worksheet For Measures Of Central Tendency Of Grouped Data

www.studypool.com
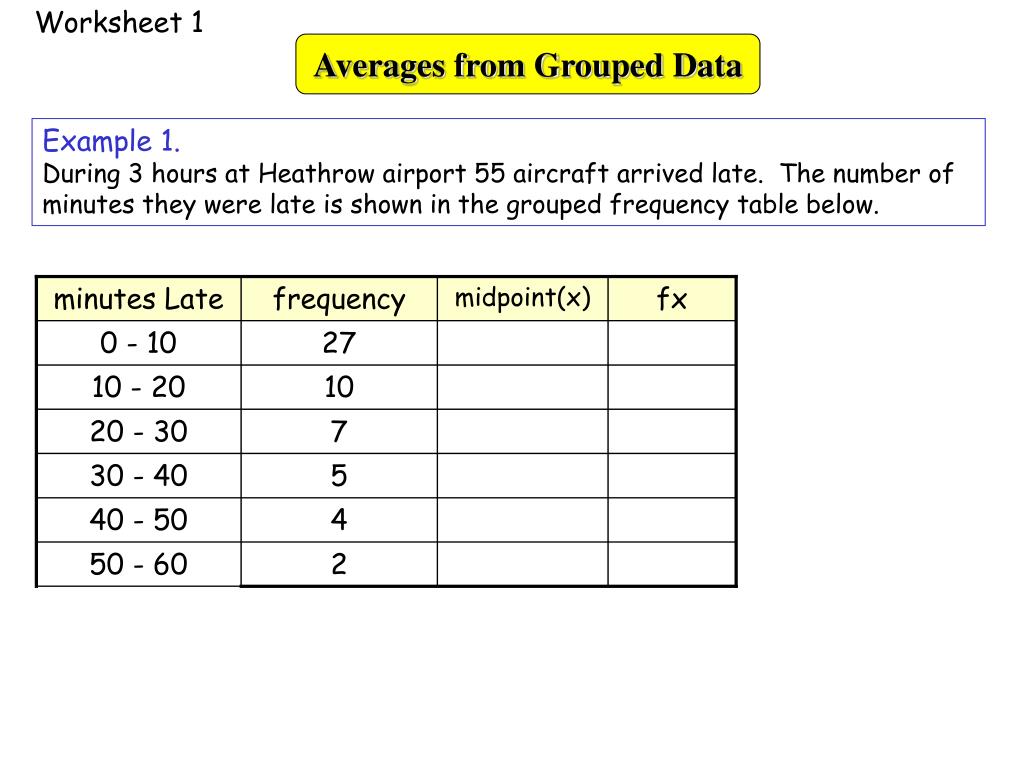
Measures Of Central Tendency Worksheet – E-streetlight.com
www.e-streetlight.com
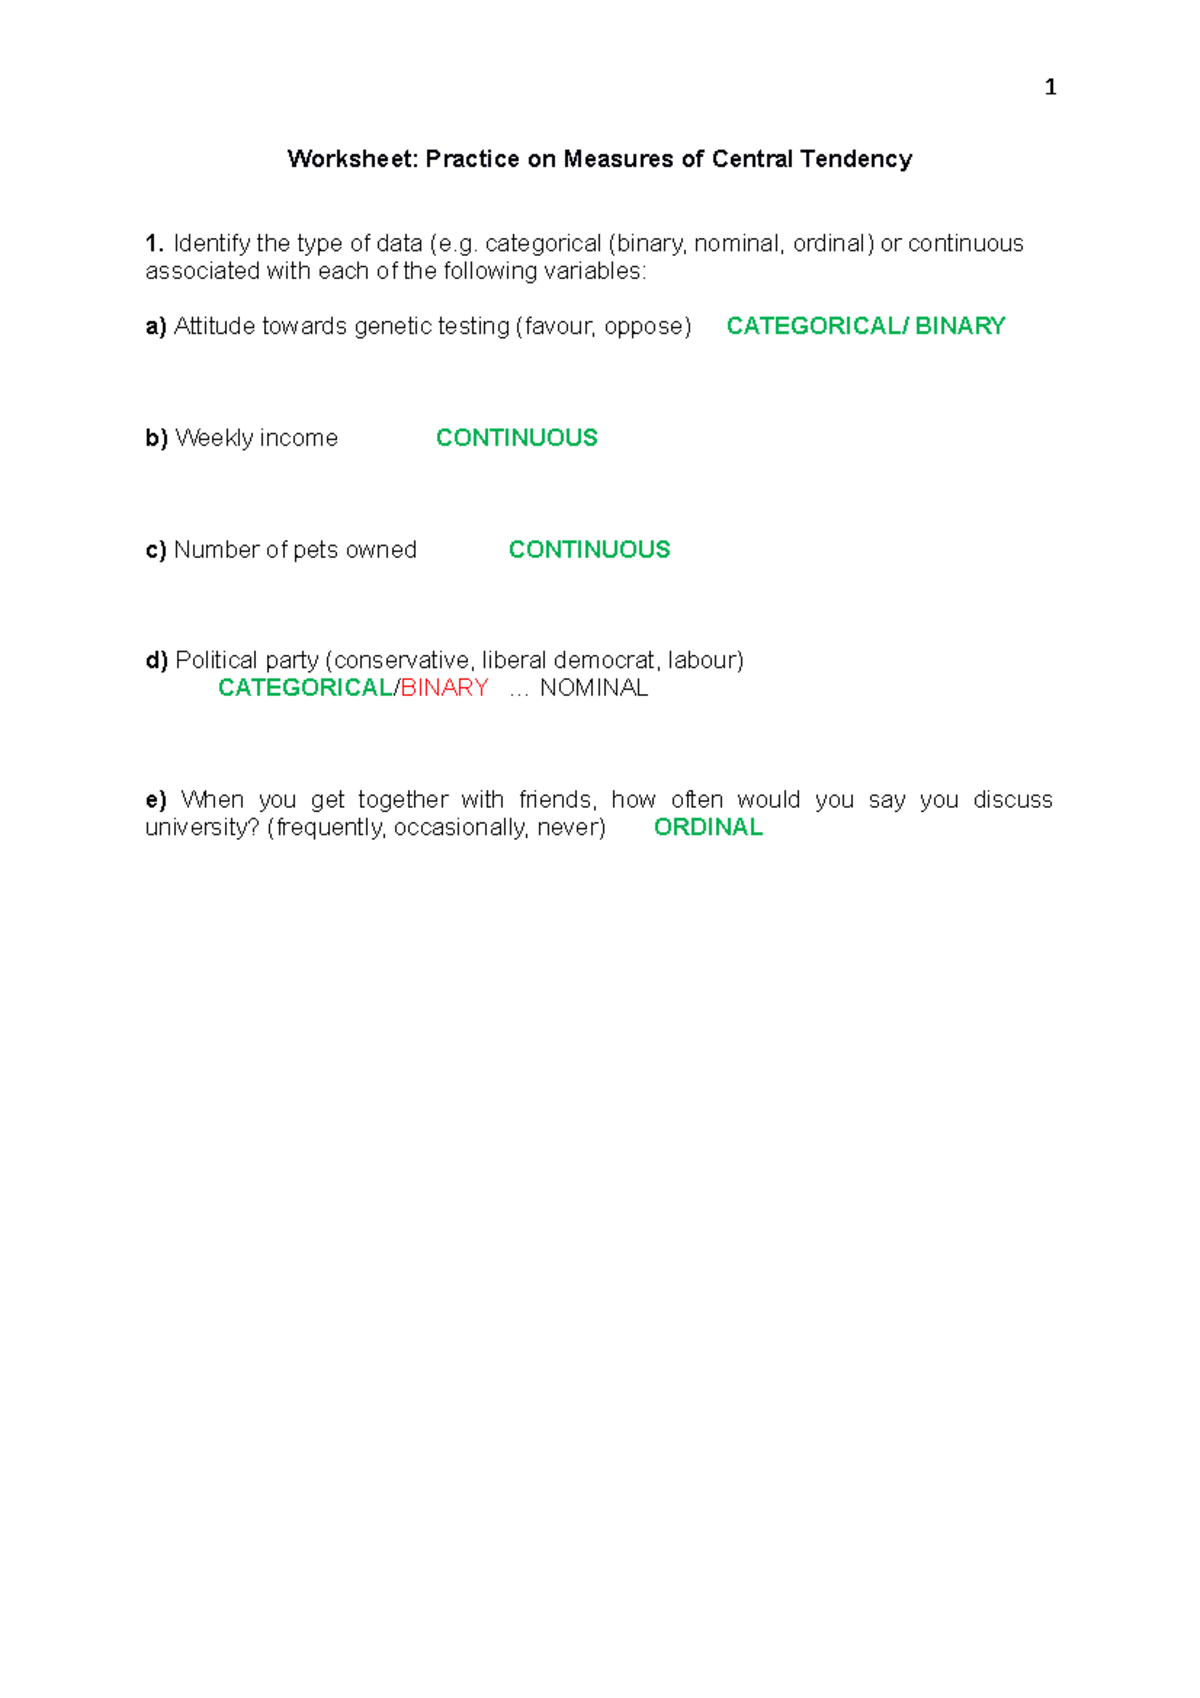
Central Tendency Worksheet – Worksheet: Practice On Measures Of Central
www.studocu.com
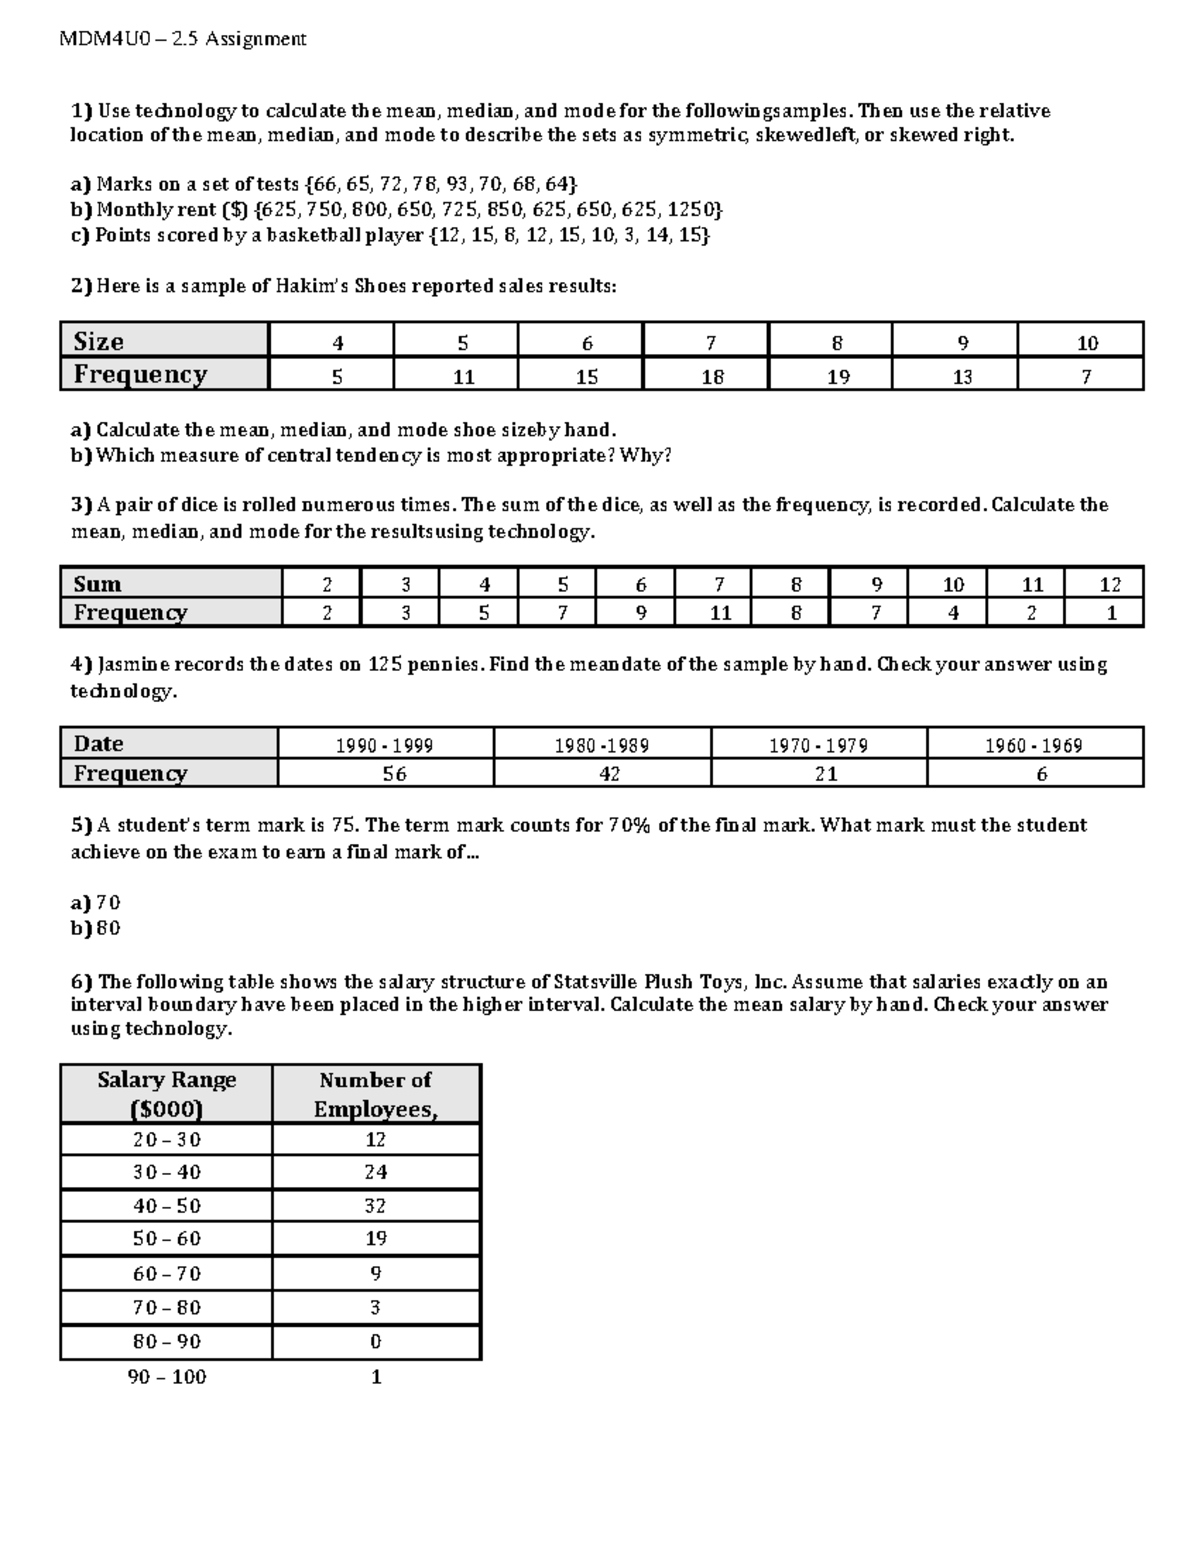
2.5 Measures Of Central Tendency Worksheet Assignment – MDM4U0 – 2
www.studocu.com
SOLUTION: Measures Of Central Tendency Activity – Studypool

www.studypool.com
Worksheet- Measures Of Central Tendency – Name

www.studocu.com
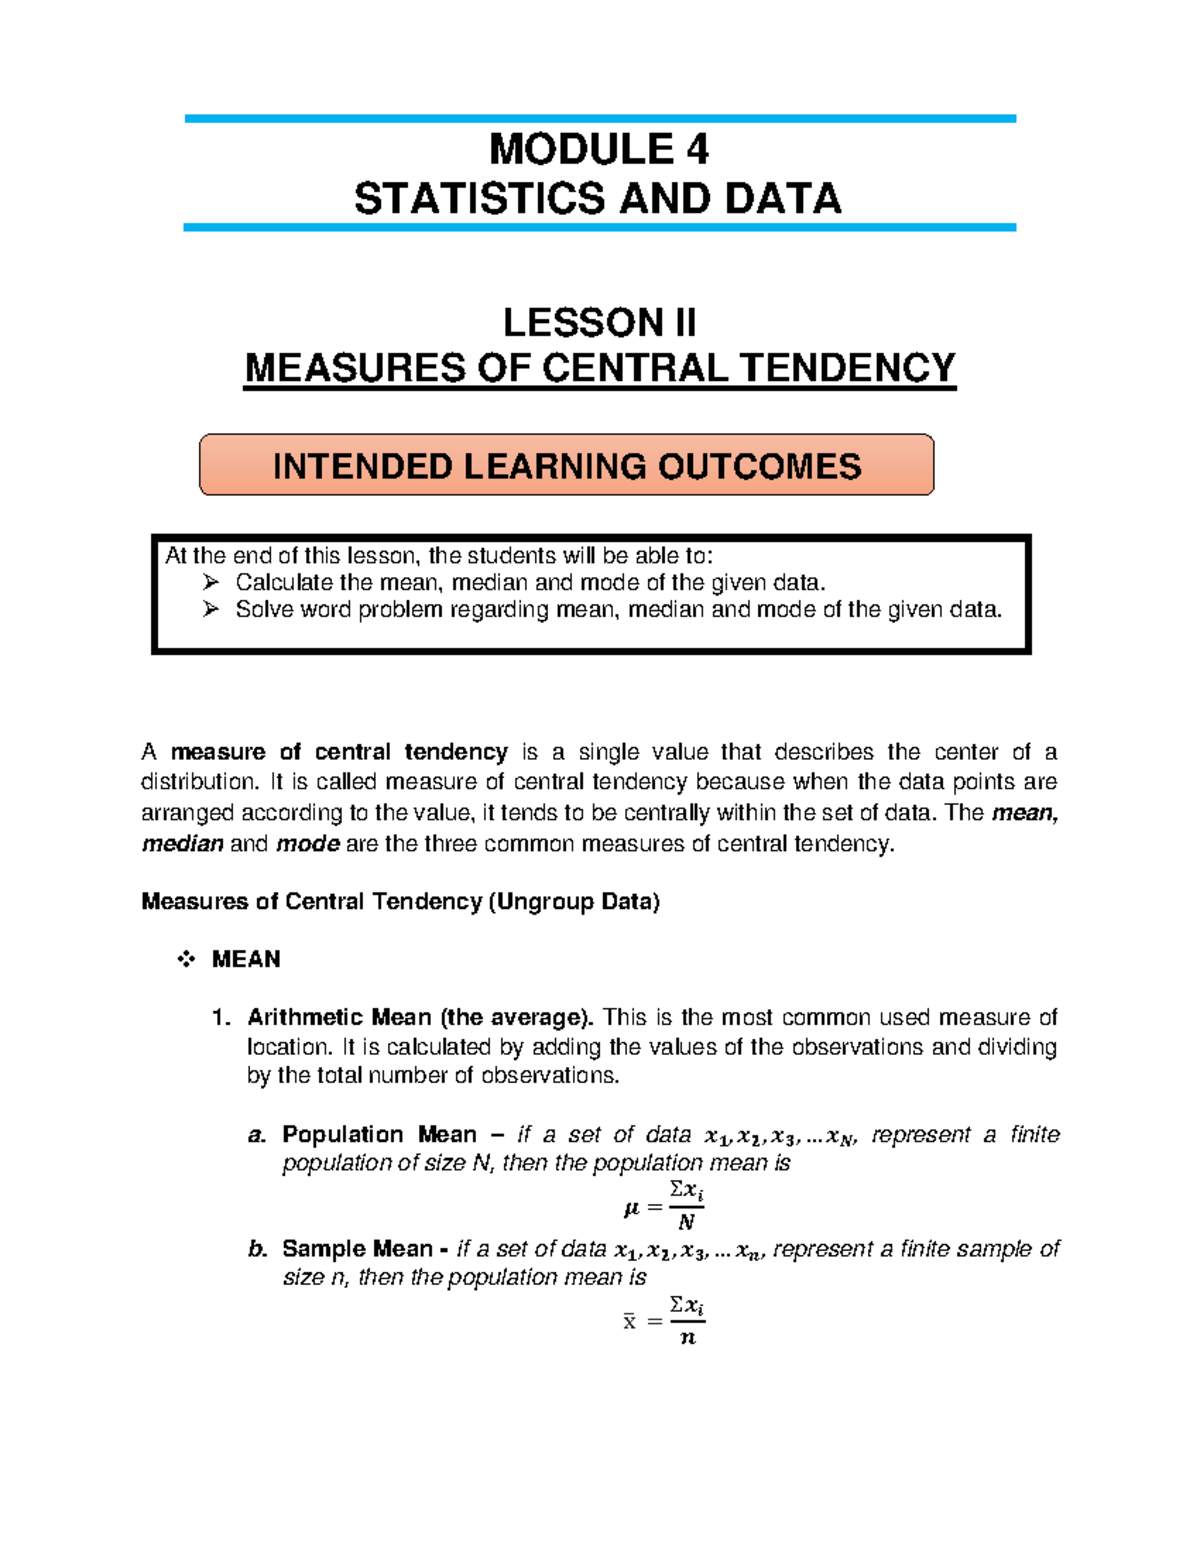
Lesson 2 – Measure Of Central Tendency – MODULE 4 STATISTICS AND DATA
www.studocu.com
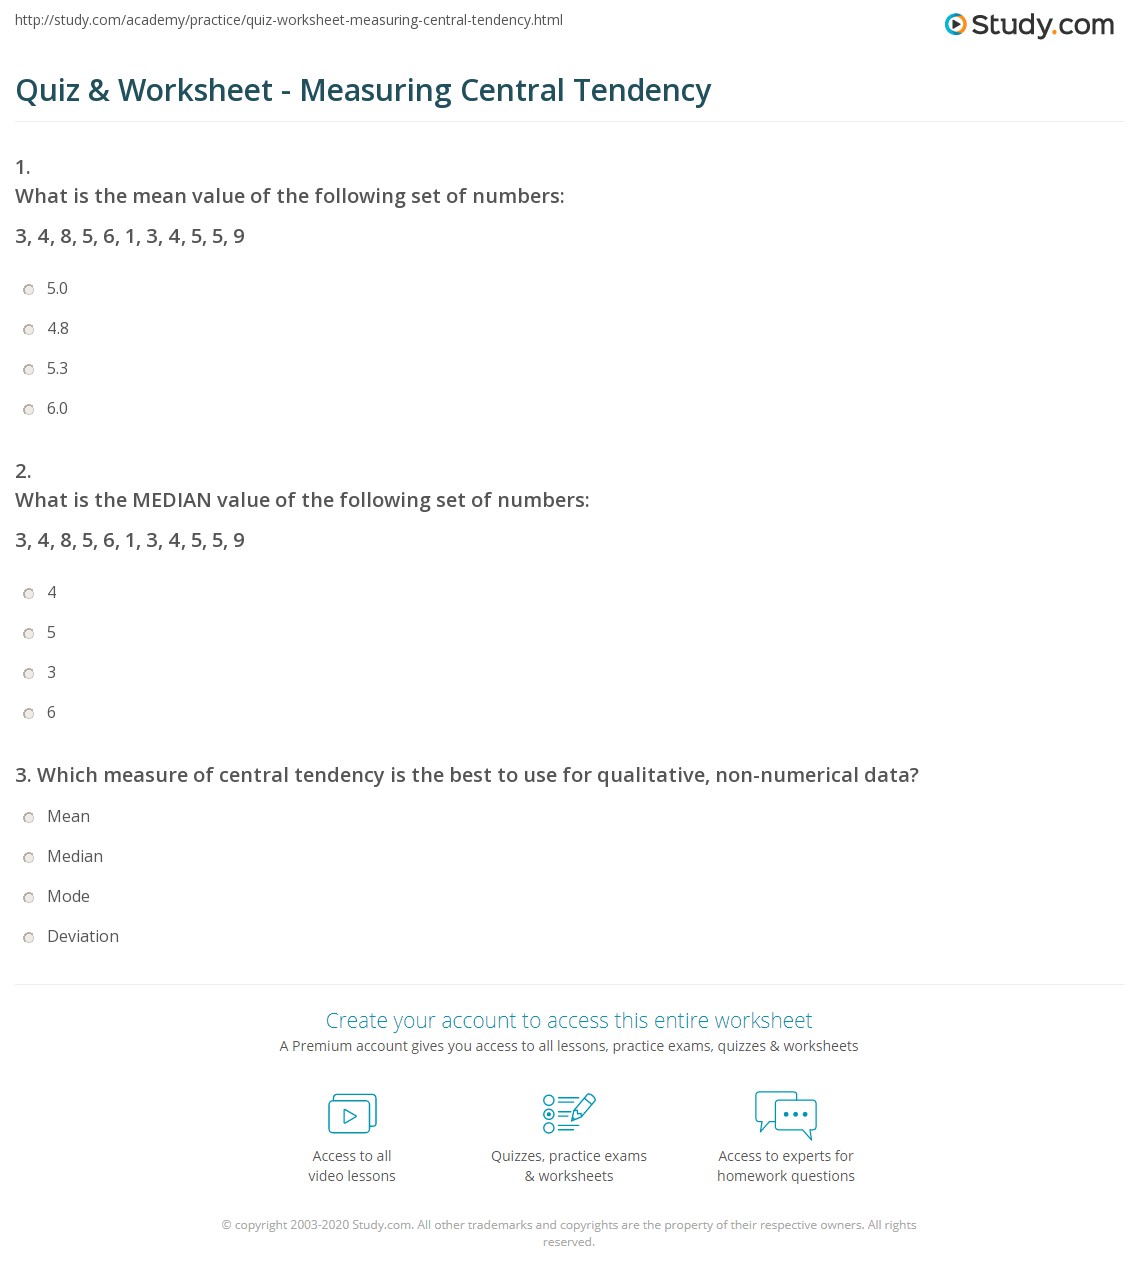
Quiz & Worksheet – Measuring Central Tendency | Study.com – Worksheets
worksheets.clipart-library.com
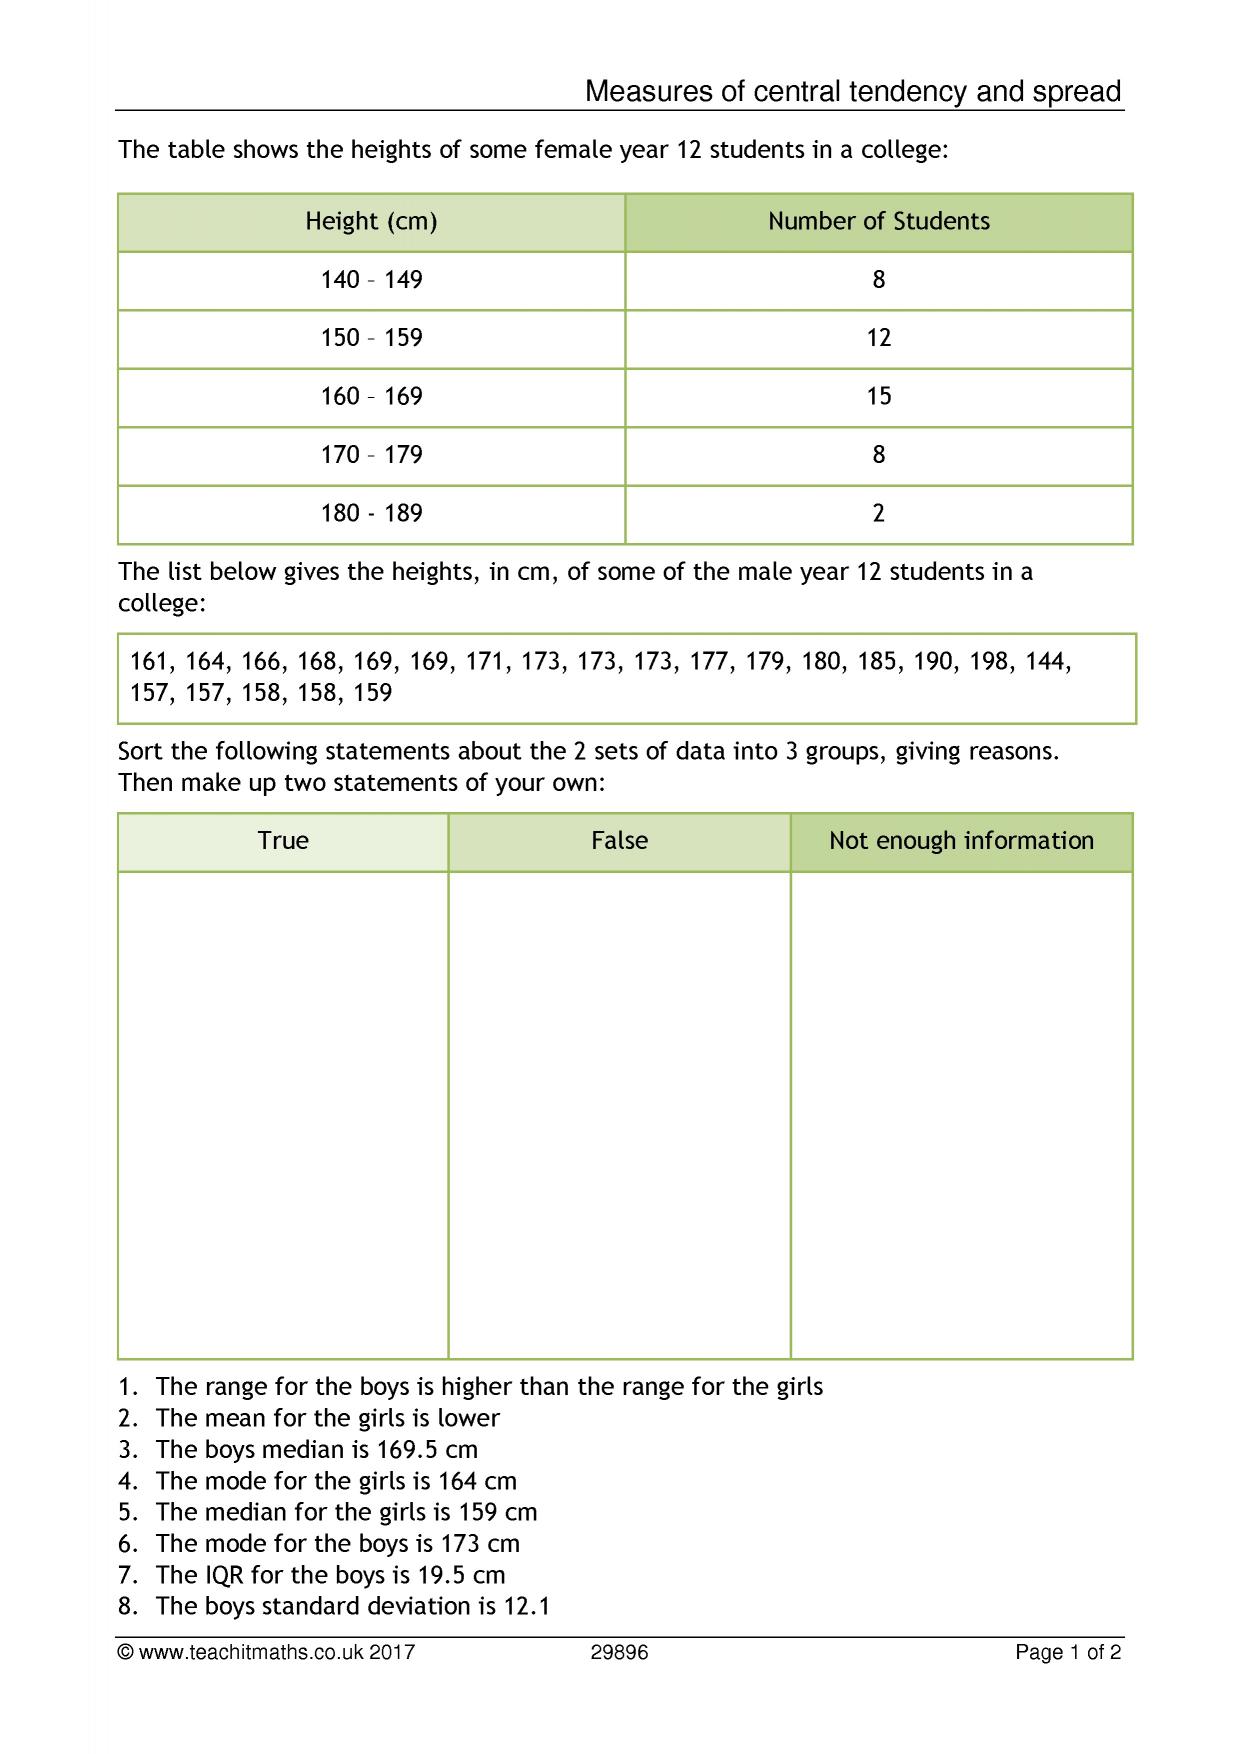
Central Tendency And Spread¦KS4-5 Maths¦Teachit – Worksheets Library
worksheets.clipart-library.com
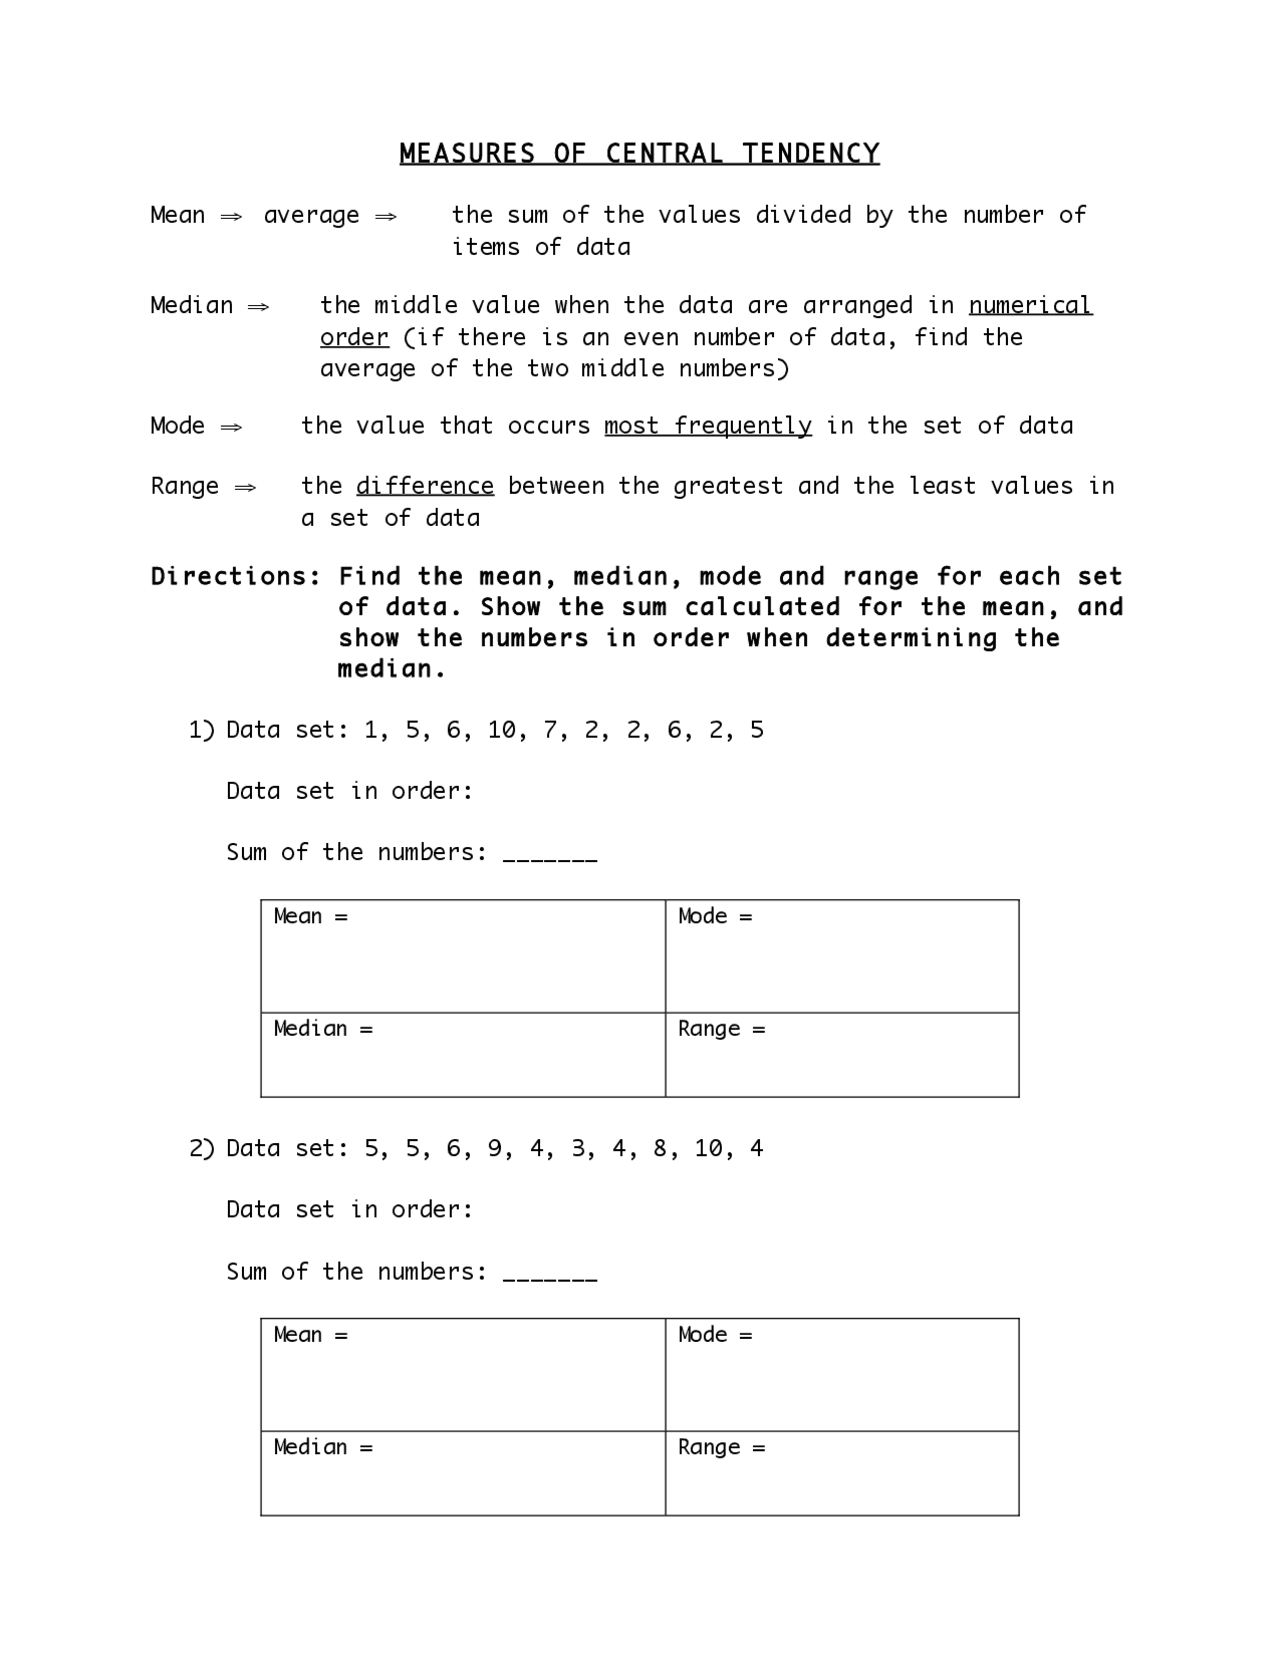
Central Tendency Worksheet.pdf | Lecture Notes Statistics | Docsity
www.docsity.com
SOLUTION: Measure Of Central Tendency 2 Worksheet 1 – Studypool

www.studypool.com
SOLUTION: Measure Of Central Tendency 2 Worksheet 1 – Studypool

www.studypool.com
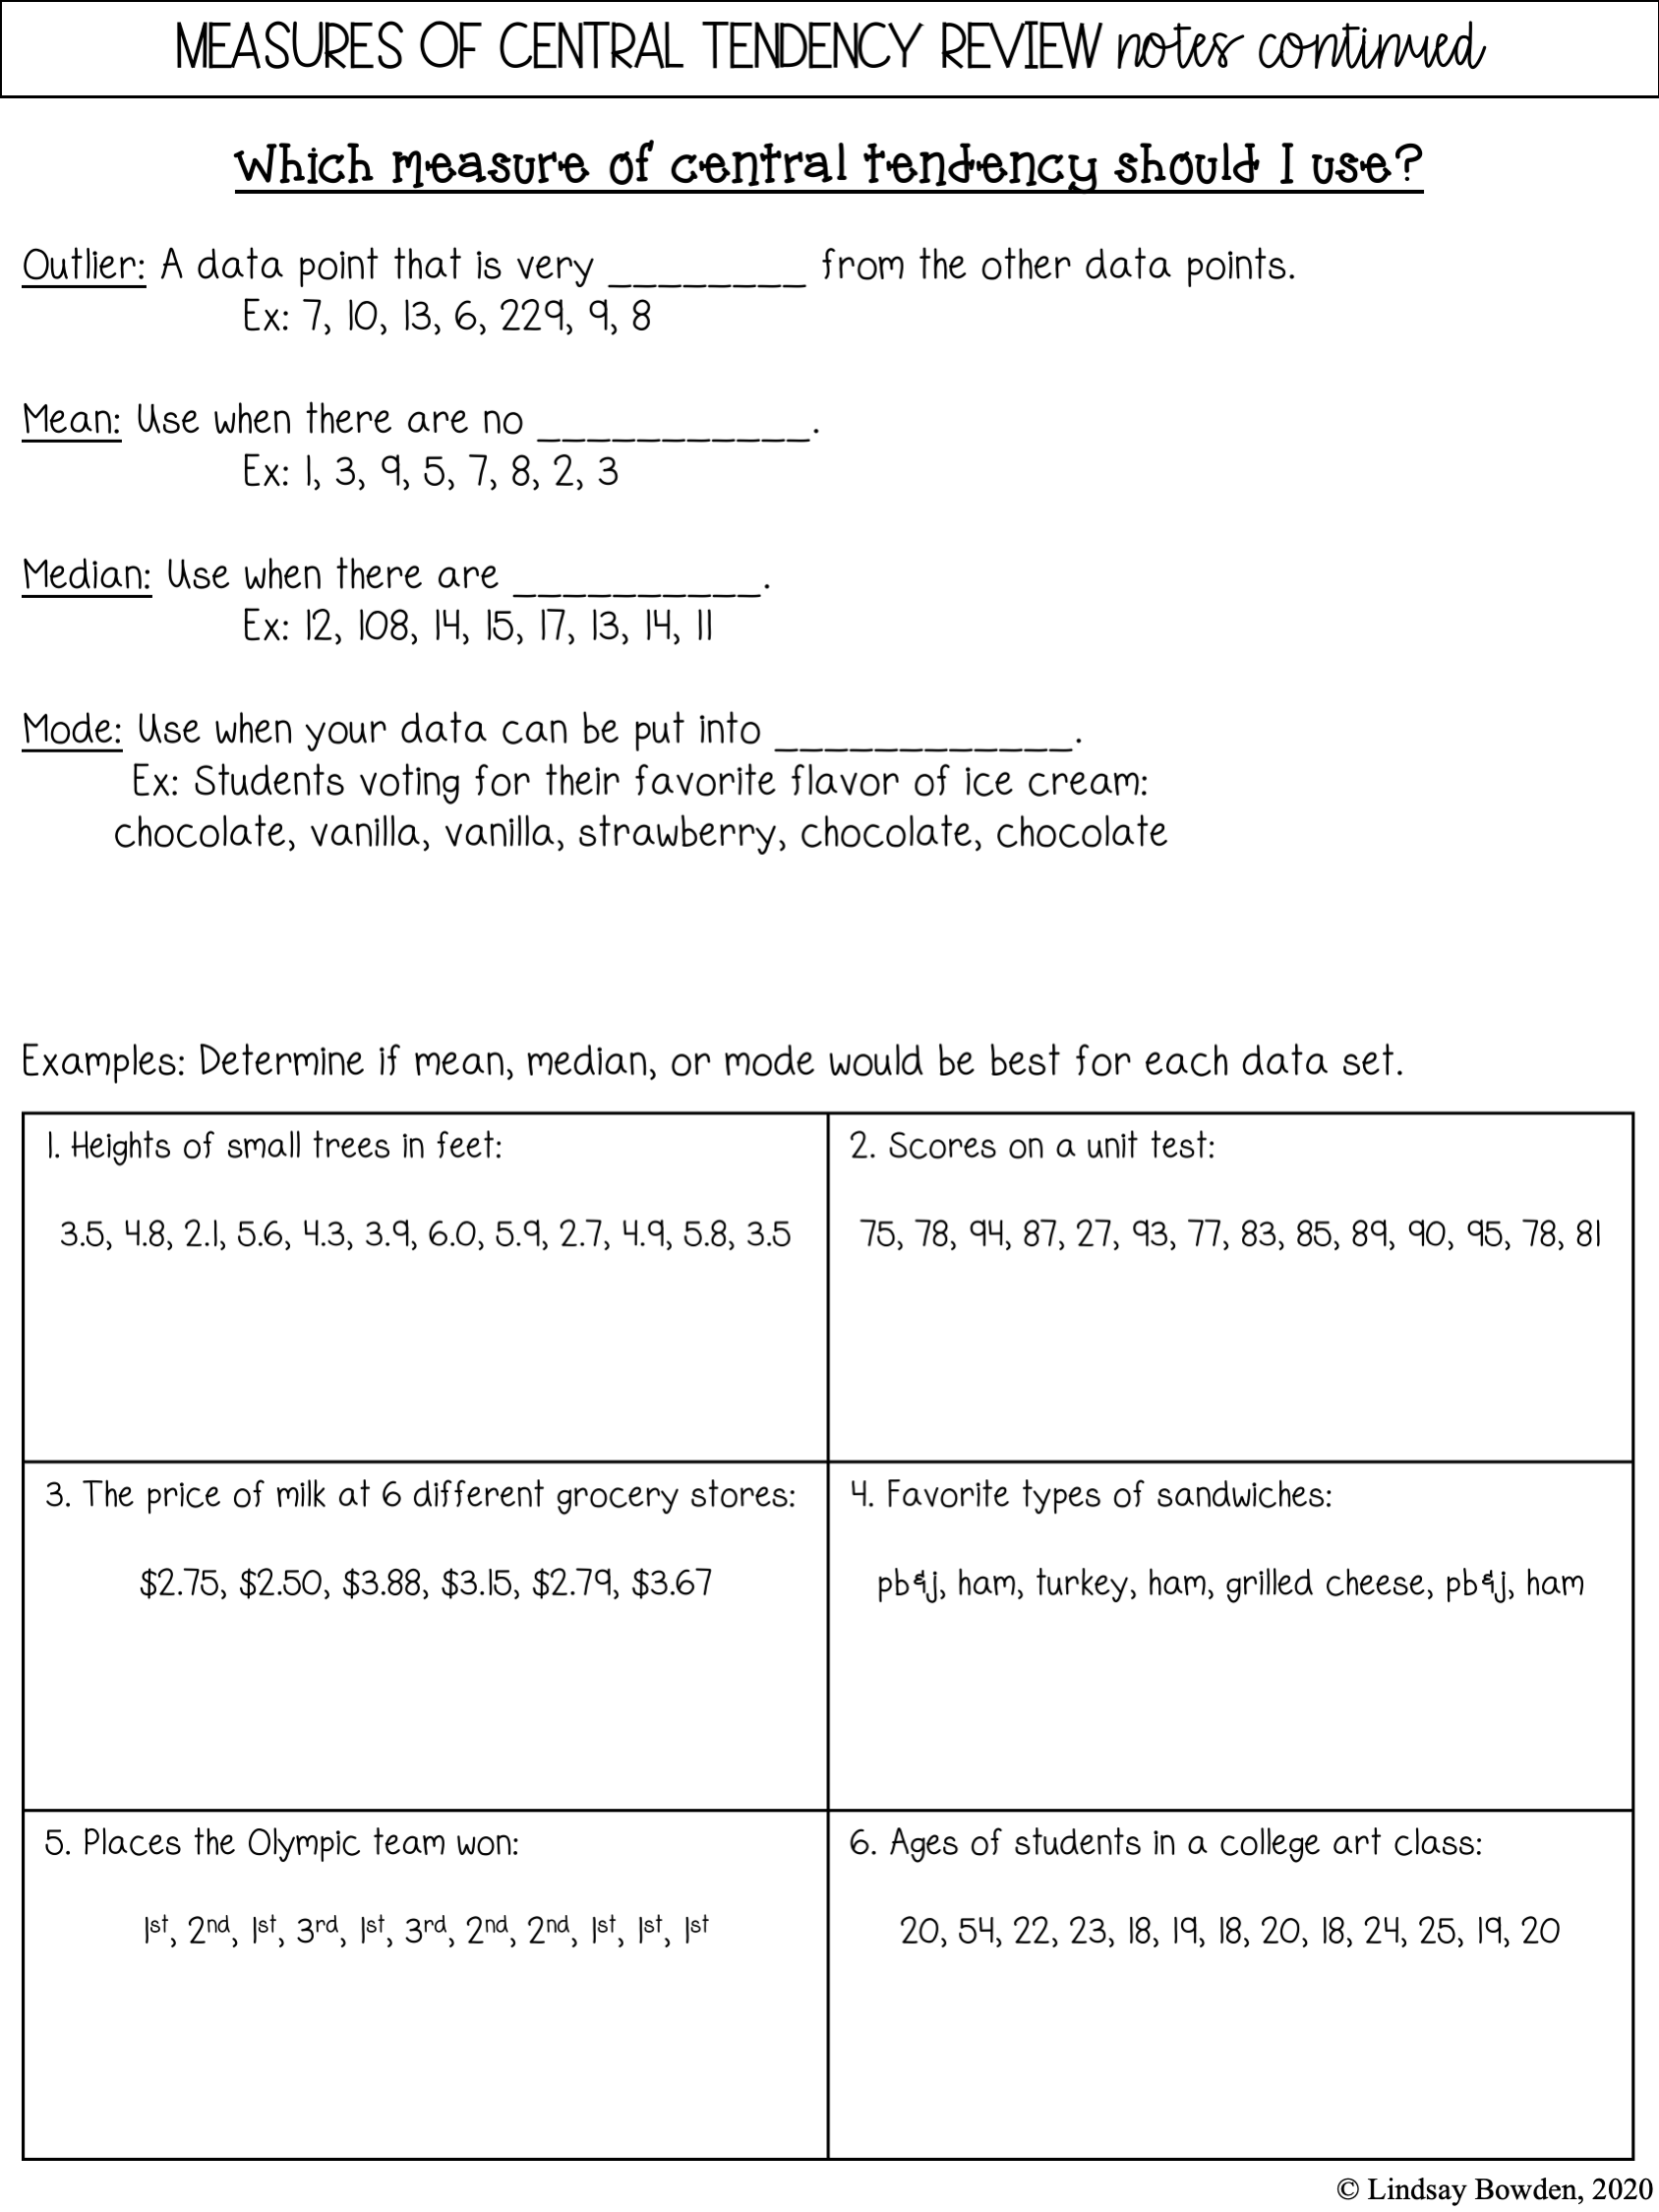
Measures Of Central Tendency Worksheet – Pro Worksheet
www.proworksheet.my.id
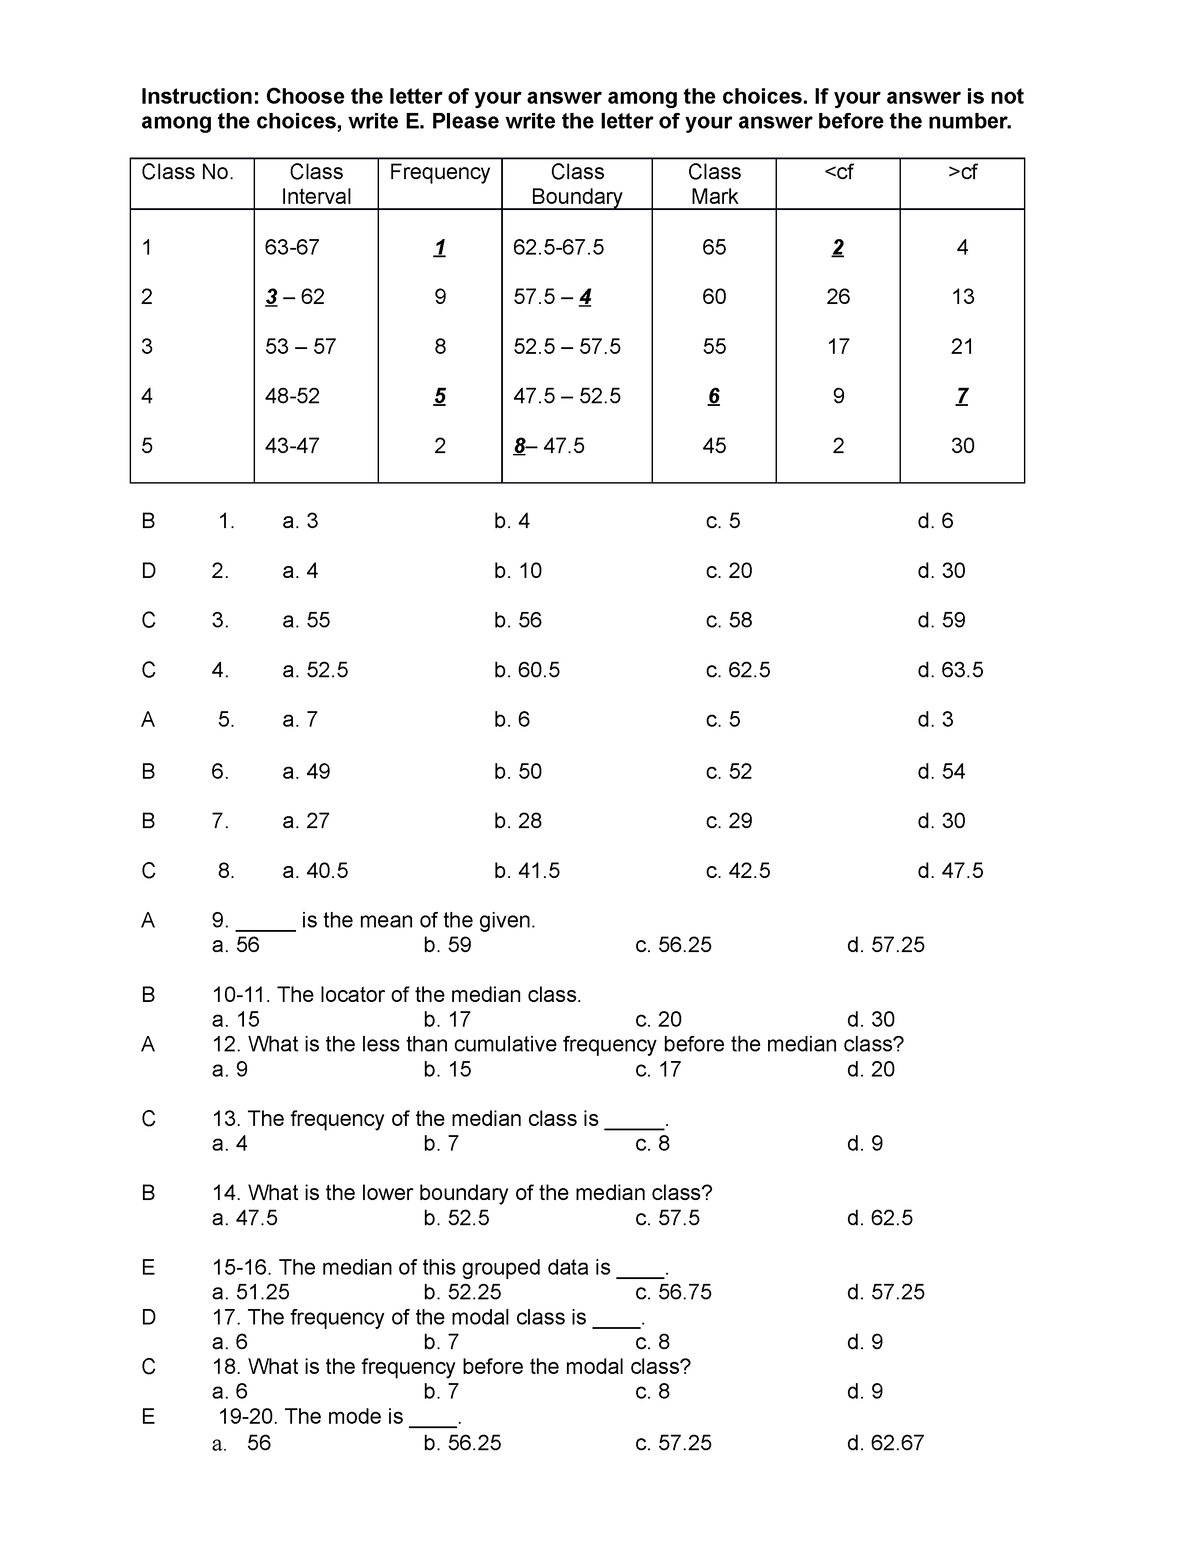
Measure Of Central Tendency Grouped Data – Instruction: Choose The
www.studocu.com
worksheet- measures of central tendency. Solution: measure of central tendency 2 worksheet 1. Measures of central tendency worksheet – pro worksheet