Are you looking for a comprehensive resource to help your students understand and interpret speed vs. time graphs? Look no further! A well-designed Speed vs. Time Graph Worksheet is an invaluable tool for teaching kinematics and motion. These graphs are fundamental to physics and understanding how the speed of an object changes over a period of time. By analyzing these graphs, students can extract key information such as acceleration, deceleration, constant speed, and even the distance traveled.
Many students initially struggle with differentiating between distance-time graphs and speed-time graphs. It’s crucial to emphasize that the y-axis in a speed-time graph represents speed, not distance. This simple distinction is the key to unlocking a deeper understanding of the relationships between these variables. When introducing this topic, begin by reviewing the basic concepts of speed, time, and acceleration. Explain that acceleration is the rate of change of speed, which can be visualized as the slope of the line on a speed vs. time graph.
A good Speed vs. Time Graph Worksheet will typically include a variety of graph shapes, from horizontal lines representing constant speed to sloping lines representing constant acceleration or deceleration. Some worksheets might also include curved lines, which indicate variable acceleration. The worksheet should present questions that challenge students to not just identify the type of motion, but also to calculate the acceleration or deceleration based on the slope. Furthermore, it should include questions that require students to calculate the distance traveled, which can be found by calculating the area under the curve of the speed-time graph.
Worksheets should also incorporate real-world scenarios to make the learning process more engaging. For example, questions could involve a car accelerating from a stoplight, a runner slowing down after a race, or a cyclist maintaining a constant speed on a flat road. By connecting these abstract concepts to relatable situations, students can develop a stronger intuition for the physics involved.
Beyond the basic calculations, challenge students to think critically about the assumptions underlying the graphs. For example, do the graphs assume constant acceleration? What are the limitations of the model? Encouraging this level of critical thinking will help students develop a deeper and more nuanced understanding of speed vs. time graphs.
Finally, encourage students to explain their reasoning. Don’t just accept numerical answers. Ask them to explain how they arrived at their conclusions and why their answers make sense in the context of the problem. This practice will not only reinforce their understanding of the concepts but also improve their communication skills.
Understanding the Concepts
Key Elements of a Speed vs. Time Graph:
- X-axis: Represents Time (usually in seconds or minutes).
- Y-axis: Represents Speed (usually in meters per second or kilometers per hour).
- Slope: Represents Acceleration (positive slope indicates acceleration, negative slope indicates deceleration).
- Area under the curve: Represents the Distance Traveled.
Answers to a Sample Speed Vs Time Graph Worksheet
Here’s a sample of the type of answers you might find on a typical Speed vs Time Graph Worksheet. This example uses a simplified graph for illustrative purposes.
- Question 1: Describe the motion of the object between 0 and 5 seconds.
- Answer: The object is accelerating from rest. The speed increases linearly with time.
- Question 2: Calculate the acceleration of the object between 0 and 5 seconds, given the speed at 5 seconds is 10 m/s.
- Answer: Acceleration = (Change in Speed) / (Change in Time) = (10 m/s – 0 m/s) / (5 s – 0 s) = 2 m/s².
- Question 3: Describe the motion of the object between 5 and 10 seconds.
- Answer: The object is moving at a constant speed of 10 m/s. There is no acceleration during this interval.
- Question 4: Calculate the distance traveled by the object between 5 and 10 seconds.
- Answer: Distance = Speed x Time = 10 m/s x (10 s – 5 s) = 50 meters.
- Question 5: Describe the motion of the object between 10 and 15 seconds, if the speed at 15 seconds is 0 m/s.
- Answer: The object is decelerating (slowing down). The speed decreases linearly with time until it comes to a stop.
- Question 6: Calculate the deceleration of the object between 10 and 15 seconds.
- Answer: Deceleration = (Change in Speed) / (Change in Time) = (0 m/s – 10 m/s) / (15 s – 10 s) = -2 m/s². (The negative sign indicates deceleration).
- Question 7: Calculate the total distance traveled by the object between 0 and 15 seconds.
- Answer:
- Distance from 0-5s: (1/2) * base * height = (1/2) * 5s * 10m/s = 25m
- Distance from 5-10s: 50m (calculated above)
- Distance from 10-15s: (1/2) * base * height = (1/2) * 5s * 10m/s = 25m
- Total Distance: 25m + 50m + 25m = 100m
- Answer:
- Question 8: What is the average speed of the object from 0 to 15 seconds?
- Answer: Average speed = total distance / total time = 100m / 15s = 6.67 m/s (approximately).
This sample worksheet provides a basic example. Real-world worksheets would likely involve more complex graphs and scenarios to further challenge students. Remember to provide clear instructions and encourage students to show their work.
If you are searching about 11 Fascinating Facts About Speed Unveiled – Facts.net you’ve came to the right web. We have 20 Pictures about 11 Fascinating Facts About Speed Unveiled – Facts.net like Broadband Speed Testing Giant Ookla Acquires RootMetrics – ISPreview UK, speed test | STELLAR Broadband East Lansing, MI and also Debunking Another Myth “SPEED”. Read more:
11 Fascinating Facts About Speed Unveiled – Facts.net

facts.net
The Importance Of Website Speed For SEO 🔥 | Tips To Improve Performance

marketingmatrixai.com
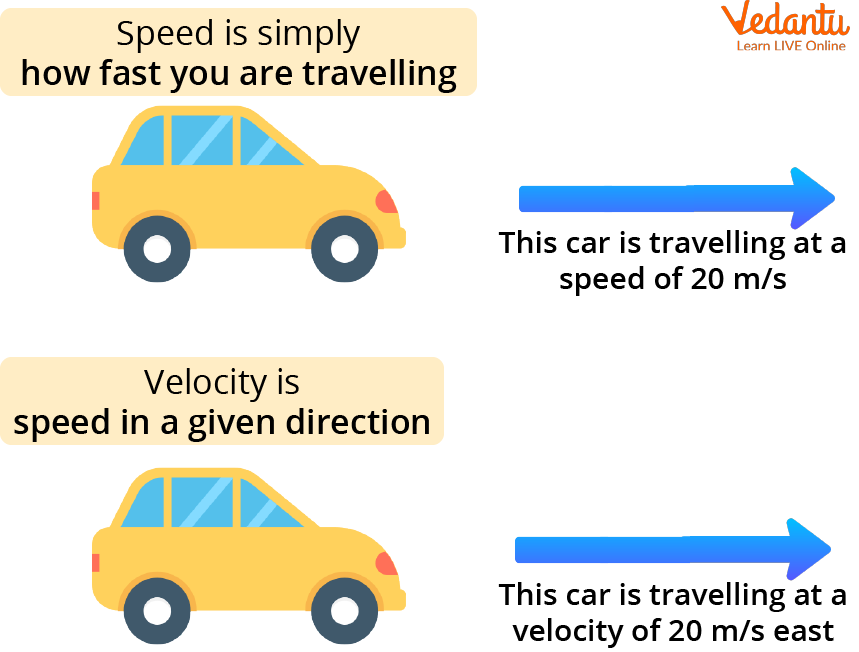
Speed – Definition, Measurement, Unit And Interesting Facts About Speed
www.vedantu.com
What Speed Actually Means In Physics
:max_bytes(150000):strip_icc()/GettyImages-843131716-5adca72504d1cf0037ae7dee.jpg)
www.thoughtco.com
Our Guide To Increase Your Website Speed Optimisation

digital8.com.au
K-Sport Blog: How To Improve Speed?

www.k-sport-uk.co.uk
Why Website Speed Is So Important – Digi Sparkz

digi-sparkz.com
Debunking Another Myth “SPEED”

www.dollardrivingschool.com
11 Fascinating Facts About Speed Unveiled – Facts.net

facts.net
Line Speed – DevX Tech Glossary

www.devx.com
Speed – Wikiwand

www.wikiwand.com
Business Fleet Africa

trucksmag.co.za
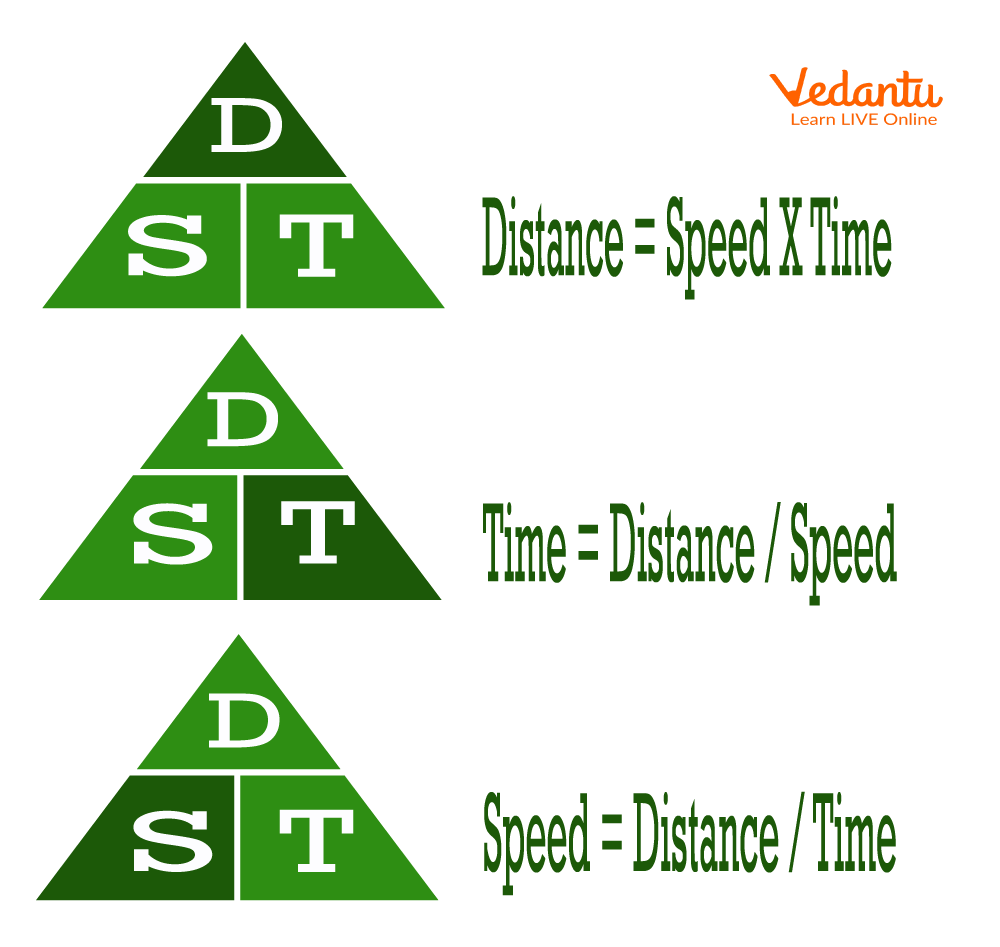
Speed Formula
ar.inspiredpencil.com
Speed Wins: How Speed To Lead Creates A Sustainable Competitive

www.leandata.com
Speed Test | STELLAR Broadband East Lansing, MI

myaccount.stellarbb.com
Broadband Speed Testing Giant Ookla Acquires RootMetrics – ISPreview UK

www.ispreview.co.uk
Is 'Speed' A Synonym Of 'Success'? | Merriam-Webster

www.merriam-webster.com
Blog: Why Speed Is Crucial To Your Website | Elms Creative

www.elmscreative.com
Speed Isn't Everything In Technology

iphoneislam.com
Why Your Website Speed Matters And How To Optimize It

upshotfirm.com
speed test. Speed wins: how speed to lead creates a sustainable competitive. Is 'speed' a synonym of 'success'?